By Judah L. Schwartz, Harvard University
a step in the direction of enhancing mathematical insight
for teachers and the students they teach
What is the real value of interactive manipulable mathematics software?
Many educators see value in hands-on learning. To me the essential attribute is the ability to manipulate the things one studies, letting the learner explore and tinker, gain experience and familiarity and build intuition.
However, the long-term goal of using hands-on is to reach minds-on—an understanding of, and appreciation for the abstract. One might say that the point of education is to get learners, in response to objects and events in the world around them, to continually ask of themselves, “What is this a case of?”
Normally, the move from hands-on to minds-on is difficult because it requires that one move from tangible and manipulable objects to intangible, and thus presumably, non-manipulable abstractions. Many of the mathematical objects and actions that secondary students encounter don’t have easy physical embodiments to manipulate; visual representations of abstractions that can be manipulated offer a means to experiment with ideas, tinker to adjust them, and build conjectures worthy of further investigation and proof. Seeing with the physical eye and manipulating with the physical hand can help in the transition from hands-on objects to minds-on ideas.
It is here that the computer enters. Artfully crafted software environments can present learners with visual representations of the abstractions they study. Moreover, these environments often allow the user to manipulate these representations, thereby mimicking on the computer screen the act of manipulating a tangible object that happens in the context of hands-on learning. Computer environments that allow users to display such images and manipulate them are giving the users a hands-on[1] experience with an intangible manipulable.
The larger point in all of this is that appropriately crafted software environments can serve to extend the reach of our minds, allowing us to manipulate in a sensory fashion that which we could hitherto only imagine. Further, the ability to manipulate and explore images and their interaction can well led to invention and innovation. It is these interactive images—pictures for the mind’s eye—that give this essay both its title and its impetus.
On Models and Exploration
The teaching and learning of mathematics is intended, at least in part, to help us deal with the complexity of our surround. Doing so requires us as teachers and students to model that complexity and to use our mathematical tools to manipulate those models. Having built models we must also learn to cope with imprecision of these models and exercise good judgment in when and how to use them.
Models of intangible mathematical objects allow us to manipulate elements of the model to understand and explore the relationship(s) among these elements. Such models allow experimenting, interesting problem posing, the generation of ideas and conjectures. However, not everyone is comfortable manipulating symbols that act as surrogates for the objects in our surround. Many people claim to understand better when presented with a visual argument. Indeed we often hear people say “Now I see!” to indicate that they have understood something. This is probably what we mean by developing insight!
Should we consider implementing visual versions of our mathematical models? Mathematical models, visually expressed,[2] would consist of images that could be manipulated just as mathematical models, symbolically expressed, consist of symbols that can be manipulated. In many situations our current technology allows us to make such visual mathematical models. Suppose that as a matter of course we were to offer mathematical models in the form of images, screen objects that are reminiscent of, or evocative of the objects of the model in question and allow people to manipulate these screen objects in order to explore the relationships among them?
Consider the potential gains of both allowing exploration of mathematical models, both visual and symbolic, and providing teachers and students with the tools and the encouragement to explore. Students are rarely given the opportunity to control elements of their learning. Allowing students to manipulate and control the images that they use to explore the model of the situation being modeled may produce just the degree of engagement and provocation needed to get them to speculate and make conjectures. This, in turn, may lead them to a better understanding of the issue they are exploring. Further, and perhaps most importantly, it may lead us, their teachers, to a better understanding of what understanding a topic might be.
Understanding understanding
As teachers we generally agree that assessing how well we have taught and/or how well our students have understood what we have taught is best done by posing a problem that elicits a performance of some sort on the part of the students beyond simply parroting what was said to them either orally or in writing. Such performance implies change—a situation is presented and the student is asked to transform it in some way that sheds light on the problem. Asking students for performances that involve change implies that the elements of the problem situation should be manipulable in some way by the student. I’ve created a collection of Interactive Images with exactly this purpose in mind. My own use of the site, and therefore the style of many of the questions I pose on it, is for educating teachers and stimulating their thinking about questions they can pose to students, but the applets themselves could be used by students as well as teachers. Mathematical problems posed using Interactive Images elicit performance and provide students with the opportunity to make their own assessment of their actions.
In particular, I like to think of three forms of performance – mapping, constructing and deconstructing.
Mapping across Interactive Images
Mapping is identifying the correspondence of both mathematical objects and mathematical actions across at least two different complementary representations; specifically this means interpreting how each aspect of a mathematical object in one of the representations is represented in the others and how the actions—i.e., the tools for manipulating and transforming objects—in each representation are related to the actions of the other representations.
Here is an example [click here to get the live app]: A function of one variable presented in symbolic form—say x2+px+q—is plotted in the {x,y} plane and depicted as a point in the {p,q} plane.

x2+px+q, plotted in the {x,y} plane and represented as a point in the {p,q} plane
Here are some questions that can elicit mapping performance:
• Drag the point around the {p,q} plane by sliding the large YELLOW tick marks on the p and q axes. What happens in the right hand {x,y} plane?
• What conditions make the point and the parabola change color? Where are they RED? GREEN?
• What is the shape of the red/green boundary in the {p,q} plane?
• In the {p,q} plane, the boundary can be thought of as a function q(p). What is this function?
• How is it related to the discriminant of the quadratic?
• The locations of the real or complex conjugate roots of the quadratic appear in the {x,y} plane as large gold dots. Trace the complex roots in the {x,y} plane. Can you formulate a conjecture about the path of the roots as you move the point in the {p,q} plane along a horizontal line? Along a vertical line? Can you prove or disprove your conjectures?
And here [click here] is a second example designed to elicit mapping performance.

A polygon drawn in the Cartesian plane and represented as a point in the {perimeter, area} plane.
A rectangle (or any polygon) is drawn in the Cartesian plane and is also depicted as a point in the {perimeter, area} plane. Here are some questions that can elicit mapping performance:
• Every point in the first quadrant of the {width,height} plane corresponds to a rectangle.
• The applet allows you to generate either
•• a family of rectangles by moving the GOLD point along a height = constant/width curve, or
•• a family of rectangles by moving the GOLD point along a height+width = constant curve.
• Can you explain the nature of the curves generated in the {Perimeter,Area} plane as you drag the GOLD point in the {width,height} plane? qualitatively? analytically?
• Can you find the region(s) in the {Perimeter,Area} plane that correspond to all rectangle with a 1:3 aspect ratio? with a 3:1 aspect ratio?
Constructing Interactive Images
Constructing interactive images involves using the primitive elements of a mathematical topic—e.g. points, circles and lines in the case of geometry—or the constant function and the identity function in the case of algebra – to build more complex mathematical objects. These objects, the relationships among them and the way(s) in which they be manipulated constitute a mathematical model, visually expressed.
Here [click here] is an example with sample questions.

Build a triangle.
-> Given: A line segment (purple) whose length is fixed and known.
-> Given also a line segment (blue) of fixed length drawn to its midpoint and a third line segment (green) of fixed length perpendicular to it.
• Is it {always, sometimes, never} possible to build a triangle which has one of the line segments as a side and the other line segments as a median and an altitude to that side?
A second example of construction in geometry [click here]:

Build a parallelogram.
-> The length of one side AB (purple) and the two diagonals AC (green) and BD (blue) of a parallelogram are fixed and known.
• Can you construct the parallelogram ABCD ?
An example of construction in algebra [click here]:

Build a polynomial.
• Build a polynomial by multiplying and transforming products of linear functions.
• Enter a target polynomial of order n = 1, 2 or 3.
and a second example of construction in algebra [click here]:
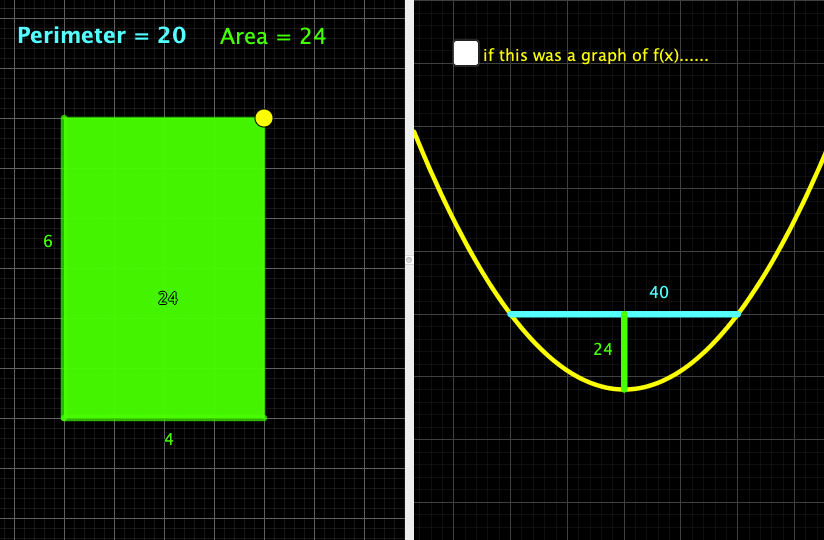
Area and perimeter of a rectangle.
• Drag the yellow dot in the left panel.
• If the curve in the right panel was a plot of the the function f(x), what would the algebraic expression of f(x) be?
• What questions could/would you put to your students based on this applet?
Deconstructing Interactive Images
Deconstructing Interactive Images involves decomposing an image into component parts, e.g. hypotenuses of triangles that may be part of a complex geometric diagram in order to uncover relationships among and within the mathematical objects in the image. In cases where the image is a graph, with polynomials or rational functions for example, deconstructing can mean decomposing the functions into the linear functions that were combined to produce them. These more elementary objects, the relationships among them and the way(s) in which they be manipulated constitute a mathematical model, visually expressed.
Here is one example [click here]:

Rectangle inscribed in square.
• A blue rectangle is inscribed in the green square.
•• What fraction of the area of the green square is occupied by the blue rectangle?
•• What fraction of the perimeter of the green square is the perimeter of the blue rectangle?
•• Drag the GOLD dot. Can you explain the shape of the curves in the right panel?
• Now let a blue square be inscribed in the green square.
•• What fraction of the area of the green square is occupied by the blue square?
•• What fraction of the perimeter of the green square is the perimeter of the blue square?
•• Drag the GOLD dot. Can you explain the shape of the curves in the right panel?
• What questions could/would you put to your students based on this applet?
And a second example of deconstruction in geometry [click here]:

Another deconstruction in geometry.
• A circle of radius 1 circumscribes a regular polygon of n sides. Inside the regular polygon is an inscribed circle. In the limit of a very large number of sides the area and perimeter of both the inner and outer circles approach those of the polygon.
•• Write an expression for A(n), the area of an n sided regular polygon inscribed in a unit circle.
•• Write an expression for P(n), the perimeter of an n sided regular polygon inscribed in a unit circle.
•• Contrast the rates at which A(n) and P(n) approach their limits.
• Challenges:
•• The number n of sides grows while the length S of each side gets smaller and smaller.
•• How does the product of n and S behave? How do you know? Can you prove it?
•• The area of a UNIT circle is π and its perimeter is 2π.
•• How do you convince a student that the area of a circle is NOT half its perimeter?
• What other questions could/would you ask you students based on this applet?
An example[3] of deconstruction in Algebra [click here]:

A deconstruction in algebra.
• Choose factoring to factor a quadratic function f(x). Then enter your function g(x) in the form a(x+b)(x+c).
• What can you learn about possible errors in factoring by examining the difference function f(x) – g(x).
• What questions could/would you ask your students based on this applet?
A second example of deconstruction in algebra [click here]:

Another deconstruction in algebra.
• Enter a function f(x) in the green box at the top center of the screen.
• Explain how the translation, dilation and reflection transformations of your function are all instances of composing that function with a linear function.
• What questions could/would you put to your students based on this applet?
Ergo…? What does this mean for us as teachers?
The central question I have tried to address is How can we use interactive images to enhance and extend the ways learners (both teachers and students) use such interactive activities to scaffold invention and innovation?
Having devoted more than five decades of my professional life to the endeavor, I am remain optimistic about the future of computers and the “pictures for the mind’s eye” that can be generated with them in mathematics and science education.
One reason to be hopeful is the amount of attention and concern about the future of mathematics education that is currently being expressed in the media. Given this degree of concern one hopes that society will make the necessary investment of intellectual and fiscal resource necessary to address the issues that it regards as pressing. In an earlier blog[4] I wrote about the one of the reasons a society maintains an educational system that includes mathematics; to provide people with the intellectual tools to model the world they encounter in the practical, economic, policy and social aspects of their lives.
A reason that I’m pleased at the existence of this AMS blog is that public discourse about mathematics education, as well as the consequent question of how well the system we now have helps us attain our goals for educating people in mathematics will increase and become more substantive. I write in the hope that incorporating new visual approaches to mathematics more fully and richly into the educational process may help us move forward in attaining those goals.
ENDNOTES
[1] More properly a hands-[mediated by mouse]-on experience
[2] Some illustrative examples of what is meant by the notion of manipulable interactive images as well as all of the examples in this essay can be found in interactive form HERE. While these examples were designed to enhance and deepen understanding and insight for teachers, teachers may find many of them useful in working with students. The decision to do so should depend on the teachers’ judgment.
[3] “FOIL” (First, Outer, Inner, Last) is a common school-mnemonic for (but limited to) expanding products of two binomials.
[4] https://blogs.ams.org/matheducation/2018/12/01/a-physicists-lament/