 The school year is over, commencement has come and gone, grades are in, and the summer lies ahead of us, with all of its promise of research or rest or travel, and only one potential obstacle looms in the horizon – the dreaded teaching evaluations. We have all been traumatized and scarred by teaching evals at some point in our lives. If you’re in a privileged position like mine, with tenure, chair of your department, and no promotion coming any time soon (I am only eligible to go up for promotion in like three years), you can avoid the trauma using one simple trick: just don’t look, until you have to. You know no one else will, either. But this is not the case for early career tenure-track faculty, postdocs and other visiting faculty, or for “tenure exempt” faculty (Linse, 2017). The fact is that so-called Student Evaluations of Teaching (SET) are still heavily used for reappointment and promotion, and sometimes requested by hiring committees. But another fact is that this data could potentially be useful even to senior faculty – for our own teaching but also as colleagues and mentors to these more vulnerable faculty. Last week, I attended a workshop at my institution run by my colleague in Chemistry Dr. Lynn Mandletort, designed to help us make the most of these teaching evaluations. In this post, I summarize some of my main takeaways from this workshop, and some suggestions and resources for further reading.
First, a disclaimer: This is NOT a post about how teaching evaluations are biased and awful – in my personal opinion they are, and there is a lot of writing on this very issue you can find elsewhere. For example, see this great post by Anna Haensch on the AMS Blog on Math Blogs for a few resources. Also, after doing some of the reading recommended by Lynn, it is possible that evals are not as biased and awful as I thought, but more on that later. This is a post about what we do with the measures we already have.
But why is this on the i/e blog? Good question, dear reader. Like I said above, there is a lot of research showing that SETs are biased, especially against women professors and professors of color. This is so well known by now, that there are even comedic pieces about it, see this McSweeney’s piece for a “fun” drinking game on this topic… Linse, in her article “Interpreting and using student ratings data”, claims that much of this research is overblown and maybe gives too much weight to what she calls “rare” data or outliers. I am not a sociologist nor am I an expert in these matters. But the fact is that even if not making a statistically significant difference to our ratings, the impact on women faculty, faculty of color, and other marginalized groups seen as “outsiders” to academia, is not just about statistical significance. This is emotionally taxing, on top of other emotionally taxing things that these faculty already have to do. I also wonder about how a person’s teaching is affected when they are constantly exposed to micro and macro aggressions from other faculty and students. At any rate, if you are faculty of color or woman faculty, “well, your low ratings might not ONLY be due to your gender/ethnicity/race” is not really all that helpful.
SO, that said, after being through that workshop last week, I realized that there were ways to digest the data that were more useful and less traumatic to me, and that I should share this with the i/e community. The bonus is that this should be helpful to everyone, not just mathematics instructors from minoritized groups.
Finally, the workshop!
Lynn started by emphasizing a new term/language for what we have so far called SETs – instead, we should call them Student Ratings of Instruction (SRIs). She gave us three guiding principles for what the data are (and are not), similar to those in (Linse, 2017):
- Students ratings are student perception data.
- Student ratings are not faculty evaluations.
- Student ratings are not measures of student learning.
So, how do these student ratings (or student perceptions) help us with our own teaching? First, we have to be able to organize the data in ways that are useful. Lynn led us through three main steps for this process.
Step 1: Big picture
Bates does online teaching evaluations, and we can download a .csv file with all of the data (quantitative and qualitative). After downloading, Lynn recommended we sort the data by student. When you sort the data by question or item, you might miss the “trolls” – students with a negative perception who are not representative of your class as a whole, or students with strong biases against you. We also did conditional formatting on the spreadsheet to the numerical scores to look for clumps of different colors. (See image below). This was so much easier to scan than numbers, and the feeling of seeing lots of green on my spreadsheet was great – even thought there were some yellows and reds. She then asked us to try to answer the questions: “Are there individual students who seemed to have an overall “bad” time with a string of low numbers in their responses?”

Student 9 was not a total fan, but not a total hater either…
She advised us to disregard the numerical data (especially the dreaded box plot comparing you to the whole campus, see below for the fuel of my nightmares), unless we had been teaching a course for many years, and only then to compare our new data to our old data, not to others (not even those teaching the same course in the same way).
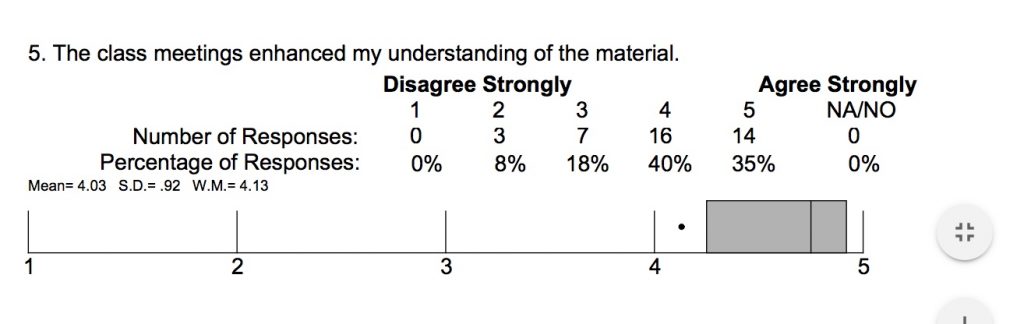
When you’re below the 25th percentile, but you also scored above a 4 out of 5… This is also a typical response to a “flipped” format, since class meetings are not everything… (see Hodges and Stanton below)
Step 2: Specifics
Once the data is sorted, we can “inspect the comments for anomalous negative comments – obvious trolling, comments on your appearance or personality, or anything that can’t be interpreted as actionable feedback on learning.” We were advised to disregard those and put them aside. (I once had a comment that basically said “Adriana is nice, but she’s not worth the whatever thousand dollars my parents pay a year” — umm, ok?).
Then we categorized the remaining comments and connected them to aspects of the course or the student experience. I particularly liked creating a table like the one shown below (I did this for both Number Theory and my Great Ideas in Mathematics course, but the latter had so few comments it wasn’t super useful).

Another recommendation I really liked was to look for places where students seem to disagree, and in particular positive comments that may counteract the negative ones. She mentioned “fear conditioning” and the fact that it is easier to commit negative experiences (and comments) to memory (see comic above!).
Then she prompted us to highlight any comments that refer to carefully thought out parts of the course, or anything that aligns closely with our teaching philosophy or other teaching goals. “This is the fodder for your dossier – either laying the groundwork for future changes or information that connects to earlier efforts.”
Step 3: Check in
We wrapped up by checking in with each other. In particular, she pointed out, as I did earlier, that SRIs are emotionally taxing for newer faculty and non-tenured faculty, and that we should take care in having these conversations with each other.
At the beginning of the workshop I thought this would be the part where I would be crying (the imposter syndrome does not really go away, no matter how tenured or furniture-like you are). But I was super satisfied. Not because my comments were overwhelmingly positive (although they were better than I expected – I suspect that I would have felt they were worse had I not done this workshop), but because I found this process to be illuminating. It was easy for me to see areas where I underperformed (I did not return work on time – I knew that already, but it is clear the students were unhappy about this, and understandably so), and areas that I was being particularly mindful of were noticed and valued (lots of comments about feeling respected and included in the classroom).
Advice for administration, tenure and promotion and hiring committees
Most of this post has been to share an activity that I found helpful, and thought could be helpful to readers of this blog. However, it is important to remember that this is a huge source of anxiety for faculty. I also want to emphasize that we DO care about how students feel and these measures are probably not going away soon. However, we can change the culture around these instruments. For example, be very clear that faculty are evaluated individually (not in relation to each other, otherwise we end up in Lake Wobegon where everyone is expected to be above average). That biases extend to committees, and are not just held by students, how do we make sure we evaluate our colleagues fairly, given that academia is structurally unfair? That SRIs are but ONE measure of a teacher, and more data need to be gathered to get a full picture. That for this to be actually useful to newer faculty, it needs to be considered a formative, not summative assessment – observe someone’s ratings for a given course through the years. Chairs and other letter writers need to provide context for outlier courses (and by the way, we all have them). T&P committees need to look at more than just an average of scores (numerical ratings of teaching will have a tail at the low end of the scale, this should not then be evaluated using a mean).
Finally, be kind to yourselves – we are all learning. And lean on your colleagues and friends – I think a key part of why this workshop was successful for me is that I was with other people who were as anxious as me.
Do you, dear readers, have any other strategies for reading your evals, both the quantitative and qualitative pieces?
For example: My friend Megan Cook, English professor at Colby College, finds word clouds useful.

Please share any ideas in the comments section below!
References