
Guest Authors:
Daniel L. Reinholz, Robin Wilson, and Amelia Stone-Johnstone
Introduction, by Daniel Reinholz
As mathematicians, we think deeply about what mathematics we want to share with our students. We think about all of the beautiful aspects of the discipline that they might be interested in. As mathematics educators, we also think about how to help our students learn these ideas. We do our best to develop  meaningful activities that can engage our students in the deep work of really doing mathematics. It takes considerable expertise to understand mathematics and to teach it well. At the same time, it can be easy to overlook who gets to participate in the activities we create. When we facilitate a discussion, how do we make sure all students are getting a chance to participate? How do we keep track of the students who do have access to opportunities to learn in our classrooms, and what do we do when we notice some students don’t seem to be getting a fair chance? This blog post focuses on one tool, EQUIP, that can help address these issues (see Reinholz & Shah, 2018; Reinholz, Bradfield, & Apkarian, in press).
Mathematics teaching and learning doesn’t happen in a vacuum. It happens in a complex, historical and evolving world. To teach equitably, and to make sure that all of our students are getting a fair chance to learn, we need to be aware of all of the ways that the world outside impacts what happens in our classrooms. There are many issues, such as — structural racism, toxic masculinity, homophobia and transphobia, ableism, stereotypes, and class-based discrimination — that marginalize some students directly (see Martin, Rousseau-Anderson, & Shah, 2017) and also can impact us subtly through implicit bias. Implicit biases are the unconscious attitudes and stereotypes that impact our actions in an unconscious manner (Staats, Capatosto, Tenney, & Mamo, 2017). Research shows that all people have biases of some sort; what is most important is that we acknowledge them and learn to address them.
EQUIP (Equity QUantified In Participation; https://www.equip.ninja) is a freely available web app for generating analytics about classroom participation. EQUIP is designed to help us gain insight into who is participating in our classrooms. Given the complexity of orchestrating a discussion with a group of mathematics students around complex mathematical ideas, it is very easy for bias to seep in our teaching in ways we are not aware of. It is in these moments that we may unconsciously favor some students over others, simply because we have been bombarded by problematic stereotypes and other messages throughout our life, or because we have preconceived notions about some students’ abilities. Research shows that this can impact even the most thoughtful teachers, for instance, who may have false perceptions that boys are more mathematically capable than girls in their classes, as early as elementary school (National Science Board, 2018).
What is needed are data that can help us understand when biases impact our teaching, so that we can become consciously aware of them and correct the issue. EQUIP provides such data that can be used after-the-fact to understand these patterns of participation. It allows us as instructors to slow down the automatic work that happens while we are teaching, so we can reflect on who is participating and how, and how this participation could relate to larger systemic factors and our own implicit biases. Since co-developing EQUIP, I know that I personally have become much more aware of my own biases and how they could impact my teaching. This awareness has pushed me even more to teach more equitably in every single class I run.
—
Here we reflect on our experiences running a professional learning community organized around EQUIP analytics. Daniel and Amelia served as facilitators in this community, and Robin was a participant looking at analytics in his own classroom. Daniel provides an overview of the EQUIP tool and the professional development process, Amelia reflects on her work as a facilitator, and Robin focuses on his experiences as a mathematics faculty member.
The EQUIP Tool, by Daniel Reinholz
EQUIP was initially designed by Daniel Reinholz and Niral Shah as a research tool for understanding patterns of participation in mathematics classrooms (Reinholz & Shah, 2018). Building on this initial work, EQUIP has now been developed into a free, fully customizable web app for professional development (https://www.equip.ninja). By default, EQUIP describes seven dimensions of student participation, but for this study, we customized it to focus only on three: type of teacher question, quality of student talk, and length of student talk. By using just a few dimensions, it streamlined our process for analyzing teaching, and facilitated quick reflection on the analytics.
The EQUIP analytics take three forms: (1) a classroom-level summary of student participation, (2) an individual-level comparison of how much each student participated, and (3) group-level comparisons (e.g., by race, gender). At the group level, EQUIP compares the actual distribution of talk-based participation with the expected distribution, using classroom demographics as a baseline. Consider a class where 40% of the class is women, but they only participate 10% of the time. This would indicate an inequity, which could be driven by an implicit bias or some other sort of contextual factor. In either case, awareness of the issue allows an instructor to take intentional action to address it. For more on the equity ratio, see https://www.equip.ninja/faq.
To generate analytics, we first create a classroom profile for each instructor we are working with. To do this, each instructor provides us with a seating chart and demographic information for their students. To protect student identities, we only use first names, and the data are not shared with anyone outside our team. During the semester, instructors share video recordings of their teaching that our team analyzes with EQUIP to generate analytics. These analytics serve as the basis for debrief conversations and collective planning on how to improve equity in mathematics teaching.
We emphasize that EQUIP does not evaluate instructors. Instead, provides a starting place for deeper conversations about race, gender, and other social markers and how they play out in the classroom. Also, the analytics don’t tell someone how to teach. There is no “target distribution” for EQUIP analytics. In other words, EQUIP doesn’t set out a particular goal, such as equal participation for all students. It is up to instructors to make sense of the data and what they will do with them, based on how they conceptualize “equity.”
The reflections below describe our use of EQUIP in a semester-long learning community organized around EQUIP analytics. The learning community began with each participant sharing their goals for the semester individually with the developer team, and after that there was a series of four meetings during the semester that focused on EQUIP analytics and change over time. The basic format is that: (1) each instructor would set a goal for their teaching, (2) they would record their teaching and have it coded with EQUIP, and (3) they would discuss the results in a safe, group-based setting. During these discussions instructors made action plans for changes in their teaching, which will hopefully be observed in the next round of analytics. In this way, EQUIP makes it easier for instructors to see improvements to their teaching over time. We now turn to Amelia’s reflection as a facilitator of the community.
Reflection as a Facilitator, by Amelia Stone-Johnstone
I write from the perspective of a graduate student who has been working with EQUIP for the past year and a half. I have used EQUIP to observe and code almost 200 teachers, ranging from middle school to college-level mathematics. In a recent project, I also played the role of facilitator — after coding and analyzing the data, I worked with Daniel to help mathematics faculty members use the analytics to guide improvements to their teaching. What I describe here is my learning process as a facilitator, and how it brought new insights into my own teaching.
As a fly on the wall it is easy to identify what is present and not present in a classroom. Is the teacher only asking the boys to explain their answers? Are certain groups of students not participating at all? When I reflect on my prior experiences of being an instructor at a community college and at an undergraduate university, I realized that I have had some of the same struggles that many of the teachers that I observed experience. How do we engage everyone in the class, and probe student thinking using high-level questions, and still have enough time to cover all the material in the short period of time? These are the types of questions that I have considered while presenting teachers with analytics from their classes. It is one thing to tell an instructor what they are not doing but it is another to help guide them through the data analysis and help them reflect on their practice. It’s easy to know what not to do — it’s harder to know what to do.
My fondest experience so far while working on EQUIP-related projects has been interacting with instructors and learning about how their experiences have guided their practice. The most recent group of instructors that we have worked with were all very excited to participate and were open to getting some feedback about what was going on in their classes. These were very thoughtful instructors. It was interesting to see the different dimensions that each instructor chose to observe about their students. For instance, besides looking at student participation in their class by race and gender, Robin (see below) was interested in looking at differences based on the number of hours of non-academic work commitment. He was curious about the extent to which working part-time affected participation in his class. He seemed very eager to use the analytics to inform his pedagogy.
While I am not teaching right now, I know that I will eventually be back in the classroom and will need to confront the everyday equity-related issues that teachers may navigate. In our biweekly meetings as a cohort of instructors, we would discuss emergent topics like how to effectively engage students in a lecture-based course, whether rotating student seating will affect the amount (and quality) of participation by different groups of students, and how we can ensure that group work is productive. It was interesting to hear the different takes on how to approach some of these problems. It was also refreshing to see that regardless of someone’s teaching experience, they have at some point had to navigate some of these same problems. We’re all in this together. In my opinion, a person’s willingness to receive feedback and listen to constructive criticism tends to make them a better teacher. As I analyzed each instructor’s video, I could see in their teaching practices how they consciously transformed aspects their pedagogy to confront some of the areas that they were interested in changing.
Reflection as a Participant, by Robin Wilson
As a mathematics teacher who has been committed to implementing equitable instructional practices for my entire career, I was surprised to find out how much I could learn from having access to data about student participation. I often hear talk about teaching and reaching “all” students in the classroom. I see this in research journals about math education, in curriculum guidelines, in blog posts about teaching, and in teaching statements from faculty job applications. This is, of course, is one of my own goals as well, to “include all students in rigorous mathematical learning and mathematical identity building” (Laursen & Rasmussen, 2019). Each day in the classroom I set out with the goal of teaching all students and getting all students to participate in meaningful mathematics activities, but without actual data about what is actually happening in my classes of 30-35 students I now realize how much in the dark I’ve been about what is actually happening in my classroom. Having access to the EQUIP data was like shining a bright light on my teaching, and it illuminated for me in a easily digestible way who was and was not participating, and in what ways the students were participating. Having the data broken down into gender and ethnicity provided an even clearer focus on what students I was and was not serving. After participating in EQUIP I’ve realized just how much that my positive feeling that I can have about how the class went, who participated, that I reached “all” students is riddled with my own biases.
My participation with EQUIP spanned the course of one semester, and at the outset I really didn’t know what to expect. What I got out of it was one of the most impactful and practical professional development experiences of my career. Here’s how it worked. At the beginning of the Fall 2018 semester I set things up so that four sessions in one of my Calculus I classes would be videotaped. (It’s always a bit nerve wracking to have a camera on me while I’m teaching, but this wasn’t my first time with a camera in the class, and I quickly forgot about it for the most part.) Before the term started I was asked to identify what demographic characteristics that I wanted to track. I didn’t have a good idea of sense of what features I wanted to identity, so I chose the categories of: 1) ethnicity; 2) gender; and 3) the number of hours each student worked each week outside of campus. I chose these categories since I was able to use the data I collected on index cards on the first day to determine how each student self-identified in terms of gender. I also collected information on hours worked the first day so I threw that in there as well. I tried my best to identify each students’ ethnic background, which certainly has its drawbacks but served its purpose, and I shared that information with the EQUIP leadership team so that they could use it to code the data. One thing I should point out is that the data was only collected during the time that I was lecturing or during whole group discussions, and student contributions were not tracked during small group or paired learning activities which was a significant portion of each class.
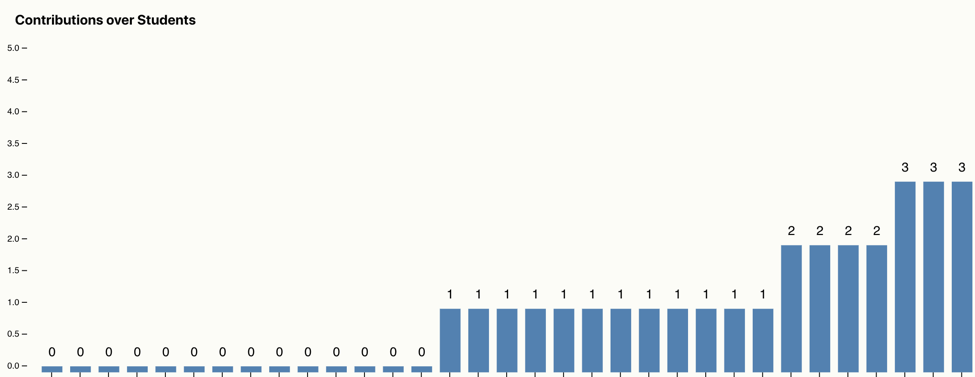
After each of the four videotaping sessions, I met via video conference with our Faculty Learning Community (FLC) consisting of the other two faculty that were using EQUIP in the college classrooms, the researcher that coded the data, Amelia Stone, and the lead researcher on the project, Daniel Reinholz. So, on the first day of videotaping the camera came and went, and the time came for our small group to meet via video conference to discuss the data from the meeting. When we met this first time, I received a pdf file summarizing the data from my course. I was presented with a “Classroom Summary” that tracked the number of students that contributed, and the total student contributions. During the group discussions we had a chance to reflect on the data for each instructor, and were able to all share suggestions for how to increase the number of students that participate, and for allowing them to participate in more meaningful ways.
Figure 1. Classroom Summary.

When I saw that 47% of the students in the class that day participated, I have to say, I felt pretty good! After discussing the data with the rest of the group however, I also became increasingly aware that this also meant that the glass was half empty, and that the evidence did not suggest that I reached all students that day. It bothered me that without giving all students the opportunity to participate, it was very possible that I was not providing all students with access to rigorous math learning and identity building opportunities. What was most surprising to me is that this wasn’t the story that I remembered about who participated, and in many ways the story that I told myself about how that class went wasn’t the same as the story told by the data. Confronting this reality was really frustrating, and brought out a range of emotions. Moreover, with this information I was face to face with the names of the exact students who didn’t get a chance to participate. Who were those students? What did I know about them? How could I do more to get them to participate?
Figure 2. Individual student contributions.
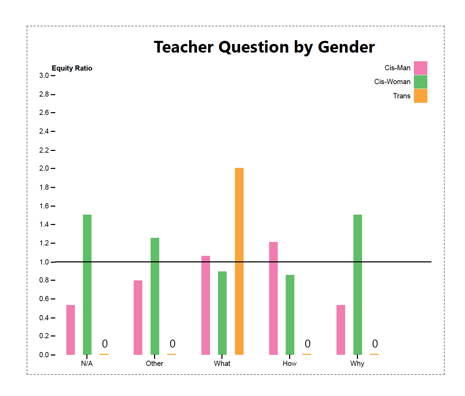
The next set of data that I was presented with was about how the students were participating. The software tracked how many “how”, “what”, and “why” questions I asked, as well as how many “how”, “what” and “why” question students answered. The software classified student responses, as long (21+ words), medium (5-20 words), and short (1-4 words). It was quite humbling to see that close to 50% of the student talk were responses to “what” questions (like “what is the derivative of x^2”) and there were only 3 students that answered “why” questions which provide a deeper level of cognitive engagement and a more effective informal assessment of student development. The worst part was that 75% of the student talk was in the form of a short answers, which showed that there was not much depth in the ways that my students were participating despite the fact that nearly 50% did contribute during the course. After the conversation with the group about this, I was motivated to do something to change this and also left with some concrete strategies. For the next class, I also took the time to dig up some resources on some simple “talk moves” (Hemingway, 2015; IOLA, 2013) that I could use to probe deeper into student thinking like “How do you see that idea?”, “Why is that true?”, and “Does your answer seem reasonable?”. This was a significant shift for me and it wasn’t an area that I would have noticed that I needed to grow in, if not for the EQUIP data.
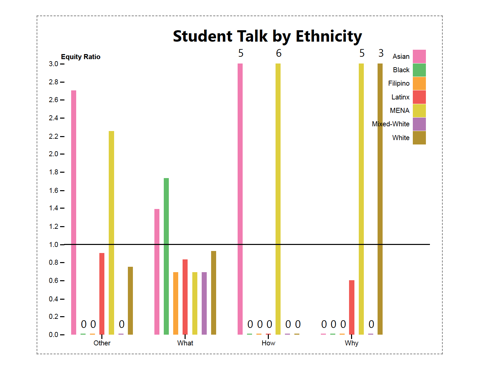
The next set of data that we were presented with was a breakdown of the contribution ratios across the demographics that I had provided to the EQUIP team at the beginning of the study. I was given the data on teacher questions, student talk, and length of talk by ethnicity, gender, and hours worked. It wasn’t much of a surprise that there wasn’t much correlation between participation and who worked the most hours outside of class and if I could do it again I think I would track the students level of math anxiety on a 1-10 scale, and their comfort having dialogue in English on a 1-10 scale since those issues seem to be relevant for the student population that I teach and the data may have more of a correlation with those demographics. The information on race and gender however, was very revealing. It was a relief to see that the cis-women and transgender man in the class were participating in at least as high a rate as the cis-men, and that there were contributions from several different ethnicities in the course. The data did reveal from the first observation that the Latinx students in the course didn’t participate as much in proportion to their representation in the classroom as did students from other ethnic groups such as the white, Asian, and MENA (Middle Eastern and North African) students. It was also apparent that I didn’t have much participation from the Filipino students in the classroom. What was to do with this information and this new lens on my teaching? Not only did I have this data in front of me, starting me in my face, but I also had the data on exactly who the students were that did not get the chance to participate in a meaningful way that day. By ignoring that fact, I felt like I would be ignoring their very existence in my classroom, and that I had to try to make some changes that were measurable by the EQUIP study the next time the camera came into videotape my teaching.
Figure 3. Comparisons of participation by social markers.
 |
 |
|---|
When I’m in front of the classroom there are lots of things running through my mind, seemingly all at once: the content I’m delivering, the sequencing of the content, the clarity of my exposition, the length of my wait time, the choice of active learning activity, my use of the board, the timing of the group activities, the time left in the class, where I left the eraser, and the list goes on. At times I find myself so overwhelmed by all of these things it’s hard to decide what to focus on. The EQUIP data however, helped with this this decision making in that it cleared room for me to shift my focus to the students. How could I get more students to participate to push pass that 47% participation rate? How close could I conceivably get to 100%? How could I get more students into the “how” question and “long answer” categories of the data analysis? I could focus on getting more Latinx students involved. I could also remember to not leave out my Filipino students the next time. In addition, I could make a list of all of the students that didn’t participate in my last class, and have it in front of me the next time we met to hold myself accountable for including them. What a powerful tool!
My experience with EQUIP helped change the focus of my teaching from thinking about what I was going to do next mathematically, to focusing on who was going to participate next in the classroom. And beyond focusing on who was participating, it also helped my focus on how they were participating. In my classes these days, I try to keep things as active as possible and for quite some time I have felt fairly good about the number of students that I’ve been able to reach. The problem however, is that this feeling is based only on my gut and that “look in their eyes” and not on hard data. This reminds me of research by my colleague Stacy Brown (2018) about the “illusion of participation”. I have been wondering for the past couple of years about how much of my own sense of student participation is really an illusion, supported by this story that I tell myself that is subject to my own biases and blind spots. In a class of 30-40 students it’s easy to think that just because I had some positive interactions with a handful of them a bunch of times throughout the day that I’m reaching everyone. But it’s clearer to me now than ever that by harnessing the power of data in our classrooms there is a lot more that we can do to achieve that seemingly impossible goal of reaching all students and provide them all with equitable access to rigorous mathematical learning and mathematical identity building.
References
Brown, S. (2018). E-IBL, proof scripts, and identities: An exploration of theoretical relationships, Proceedings of the 21st Annual Conference on Research in Undergraduate Mathematics Education, San Diego, CA, 22-24 February (pp. 1- 15).
Hemingway, K. (2015, May 26). Talk moves create a culture of talk: Fostering student talk and classroom dialogue – Part 3 [Blog post]. Retrieved from https://www.inquirybydesign.com/talk-moves-create-a-culture-of-talk-fostering-student-talk-and-classroom-dialogue-part-3/
IOLA. (2013). A typical day. Retrieved from: http://iola.math.vt.edu/typicalday.php
Laursen, S. L., & Rasmussen, C. (2019). I on the Prize: Inquiry approaches in undergraduate mathematics. International Journal of Research in Undergraduate Mathematics Education. https://doi.org/10.1007/s40753-019-00085-6
Martin, D. B., Rousseau-Anderson, C., & Shah, N. (2017). Race and mathematics education. In J. Cai (Ed.), Compendium for Research in Mathematics Education (pp. 607-636). Reston, VA: National Council of Teachers of Mathematics.
National Science Board. (2018). Science and Engineering Indicators (NSB-2018-1). Alexandria, VA: National Science Foundation. Available at https://www.nsf.gov/statistics/2018/nsb20181/assets/nsb20181.pdf
Reinholz, D. L., Bradfield, N., & Apkarian, N. (in press). Using analytics to support instructor reflection on undergraduate mathematics instruction. International Journal of Research in Undergraduate Mathematics Education.
Reinholz, D. L., & Shah, N. (2018). Equity Analytics: A Methodological Approach for Quantifying Participation Patterns in Mathematics Classroom Discourse. Journal for Research in Mathematics Education, 49(2), 140–177.
Staats, C., Capatosto, K., Tenney, L., & Mamo, S. (2017). State of the science: Implicit bias review 2017. Columbus, OH: Ohio State University: Kirwan Institute. Retrieved from http://kirwaninstitute.osu.edu/wp-content/uploads/2017/11/2017-SOTS-final-draft-02.pdf