Guest Post by Helen G. Grundman, Director of Education and Diversity, AMS
About a year ago, the American Mathematical Society (AMS) agreed to take part in the National Science Foundation-funded STEM Inclusion Study. The study’s goal is to identify potential mechanisms of disadvantage at the interpersonal, organizational, and professional levels in science, technology, engineering and math (STEM) fields. It is the first large-scale, national-level study to simultaneously examine the experiences of women, racial and ethnic minorities, persons with disabilities, and lesbian, gay, bisexual, transgender, and queer or questioning individuals working in the STEM workforce. The study has two phases: first a survey of large samples of the members of participating  professional organizations, then in-depth interviews with selected survey participants. By participating in the study, professional organizations not only guaranteed that their members will be represented in the broad results of the survey, but they also received a summary of their member’s answers to a small subset of the survey questions. The summary provides some insights into the beliefs and experiences of our members, specifically concerning their places of work, but does not provide any of the details that researchers expect to glean from follow-up interviews with a smaller sample of the survey participants. (Note that for most of this analysis, only respondents who were employed at the time were included, with graduate students included only when comparing responses across employment sectors.) The goal of this post is to share the results in the summary received by the AMS.
The survey results
The (unfortunately unsurprising) findings include that women and respondents with disabilities report significantly less positive experiences than men and respondents without disabilities “on nearly every measure of marginalization and professional devaluation” examined in the study, and that there is “a pattern of negative experiences” for LGBTQ individuals. On various measures there were significant differences found when comparing responses of white participants with those of Asian participants and with those of Black participants. There were also significant differences found between Hispanic/Latinx responses and non-Hispanic/Latinx white responses. All of these results were analyzed controlling for employment sector, education level, and age.
In many ways, however, the survey responses paint a rather positive picture of mathematics as a profession. The researchers report that among the respondents, personal experiences of harassment are relatively low, and that across demographic groups, respondents generally feel that their work is respected by their colleagues and that their supervisors treat them with respect. Respondents on average believe their bosses give them the credit they deserve and that they do not have to work harder than others to be given the same professional recognition. Few respondents reported high levels of LGBTQ bias in their workplace (though this could be due to the lack of visibility of LGBTQ status), and the majority of respondents did not observe instances of workplace unfairness toward persons with disabilities (though this could result from low numbers of visibly disabled coworkers). While these general trends suggest that members of the AMS tend to have positive experiences in their workplaces, this was certainly not universal and, as described above and detailed in the following, significant differences were found when comparing responses between different demographic categories.
Legitimate Professional
On the question asking participants to rate their level of agreement (from strongly disagree to strongly agree) with the statement “I have to work harder than my colleagues to be perceived as a legitimate professional,” the average response for each demographic group falls between “disagree” and “neutral.” Yet, women are significantly more likely than men, Hispanic/Latinx respondents significantly more likely than non-Hispanic/Latinx white respondents, LGBTQ respondents significantly more likely than non-LGBTQ respondents, respondents with disabilities more likely than respondents without disabilities, and both Black and Asian respondents are more likely than white respondents, to agree that they have to work harder to be perceived as a legitimate professional. (In the figures throughout this blog, all of which were provided by the STEM Inclusion Study, significance is denoted as follows: ***p<.001, **p<.01, *p<.05, †p<.10, two-tailed test.)
Fig 1: “I have to work harder than my colleagues to be perceived as a legitimate professional.”
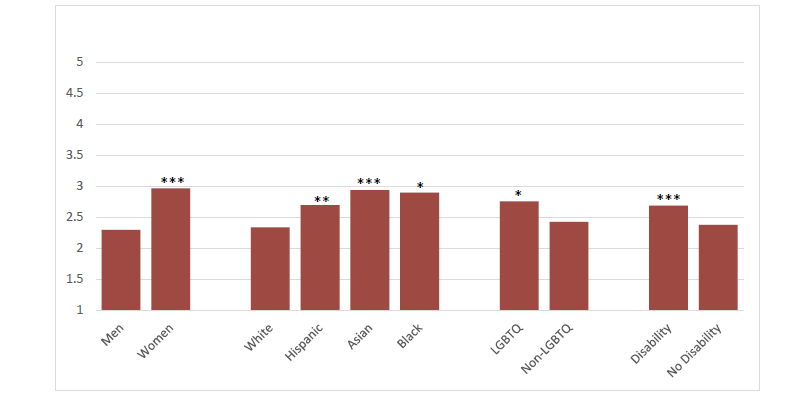 Predicted Probabilities of employed respondents, by gender, race/ethnicity, LGBTQ and disability status net of differences by sector, age, and education level. (1=strongly disagree to 5=strongly agree)
Standards for Promotion
Survey takers were asked to rate their level of agreement with the statement “I am held to the same standard as others for promotion and advancement.” This is an important question, since there is a tradition of viewing academic mathematics as a meritocracy and 79% of these respondents work in colleges and universities. All comparison groups averaged between “neutral” and “agree,” yet, women, LGBTQ respondents, and respondents with disabilities agreed significantly less strongly than men, non-LGBTQ respondents, and respondents without disabilities, respectively. In particular, it should be noted that none of the groups averaged near “strongly agree,” all falling at most slightly less than “agree.”
Fig 2: “I am held to the same standard as others for promotion and advancement.”
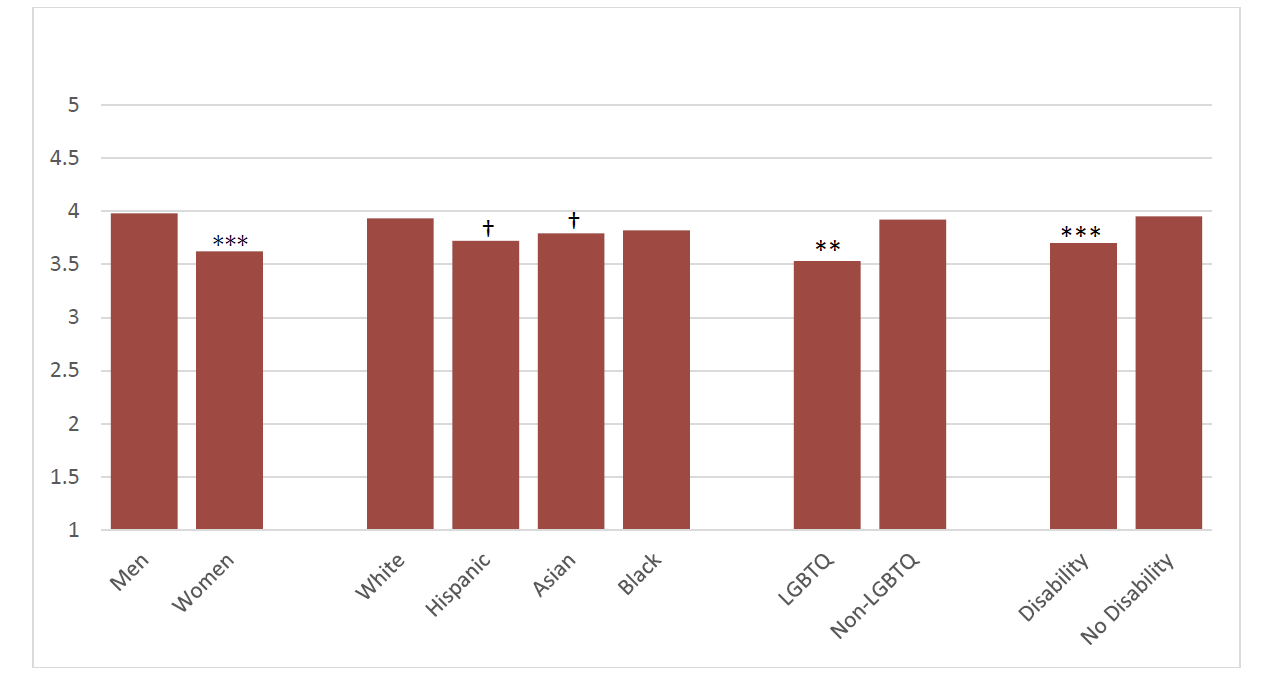 Predicted Probabilities of employed respondents, by gender, race/ethnicity, LGBTQ and disability status, net of differences by sector, age, and education level. (1=strongly disagree to 5=strongly agree)
Harassment
An important finding is that women, Hispanic/Latinx respondents, and respondents with disabilities reported significantly higher frequencies of being harassed verbally or in writing on the job in the last year, than men, non-Hispanic/Latinx white respondents, and respondents without disabilities reported. Further, in rating the frequency with which a co-worker “makes a negative comment or joke about women, racial/ethnic minorities, LGBTQ people, or people with disabilities,” significantly higher frequencies were reported by women, Hispanic/Latinx respondents, LGBTQ respondents, and respondents with disabilities. More generally, the researchers found that Hispanic/Latinx and Asian respondents “were significantly more likely than their white peers report that their competency and value was questioned in their workplace and experience professional devaluation and marginalization.”
Fig 3: “A co-worker makes a negative comment or joke about women, racial/ethnic minorities, LGBTQ people, or people with disabilities.”
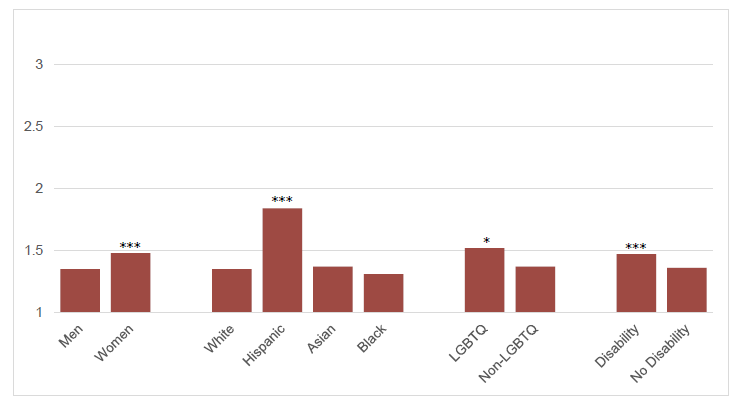 Predicted Probabilities of employed respondents, by gender, race/ethnicity, LGBTQ and disability status, net of sector, age, and education level. (1=Never, 2=At least once in the past year, 3=At least once a month or more)
Workplace Fairness
The researchers compared questions concerning what they call “workplace fairness” across the employment sectors: academic, for profit, and “other employment.” On questions asking whether or not women, racial/ethnic minorities, or LGBTQ individuals in their workplace must work harder to convince people of their competence there was no significant difference between these sectors. On the other hand, there was a significantly smaller proportion of respondents with “other employment” who reported witnessing person(s) being treated differently at work due to gender in the last three years. The same is true with “gender” replaced by “race/ethnicity.”
That said, the actual numbers in the workplace fairness section of the report should serve as a wake-up call to those of us who like to think that the inequities are few. The researchers found high proportions of respondents across the different employment sectors “reported systematic biases in their workplaces and reported witnessing differential treatment in their organizations in the last three years.” Specifically, 27.5% of respondents reported that women in their workplaces must work harder than men to be viewed as competent and 17.9% of respondents believe the same for people from racial/ethnic minorities. Further, 27.3% of respondents overall reported personally witnessing individuals’ being treated differently due to their gender, and 14.4% of reported individuals’ being treated differently because of their racial/ethnic minority status.
Fig 4: Proportion of respondents by sector who reported witnessing person(s) being treated differently due to gender in last three years.
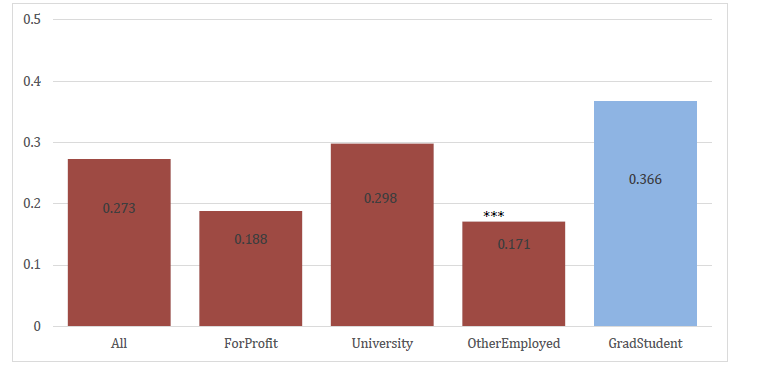 Predicted Probabilities of employed respondents by employment sector and graduate students. (Proportion who agree between 0 and 1.)
The responses from graduate students are even more striking. For example, 36.6% of graduate students reported witnessing individuals’ being treated differently due to gender in the last three years, 24.1% reported witnessing individuals’ being treated differently due to race or ethnicity, and the proportion of graduate students who reported witnessing individuals’ being treated differently due to LGBTQ status, though much smaller, was twice that of the non-student academic employees.
Additional Questions
At a request from the AMS Committee on Women in Mathematics, we asked the researchers to add some additional questions to the end of the survey given to the sample of AMS members. We learned that 29% of respondents have on-site childcare services at work and 63% are covered by a policy allowing parental leave. About 73% reported that they are aware of policies promoting diversity and inclusion at their place of work, and about 51% are at a workplace that offers training or mentoring in working effectively with a diversity of people.
Final Thoughts
Personally, I am both encouraged and saddened by these results. As I wrote above, the overall results paint quite a positive picture, yet when looking at the disaggregated data, it is clear that mathematics has a long way to go. Each of us needs to remain vigilant in the workplace and to work to find ways of stopping inappropriate behavior by our friends and colleagues. We also need to look at ourselves to see if we are unwittingly contributing to the problem.
Graduate programs need to acknowledge that inequitable treatment of students due to gender, race, ethnicity, or LGBTQ status is a problem and that they need to identify ways to address it. It is the responsibility of the department and institution to provide a safe, harassment-free environment for the students. I’d like to encourage departments with graduate students to do their own internal, anonymous surveys, preferably combined with some interviews, to obtain more details about their own situations.
I want to acknowledge the fact that the differential treatment found in this survey may well 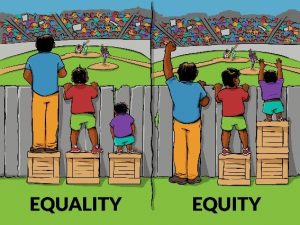 include behaviors and activities meant to address disparities that already exist in our system — what is sometimes referred to as “reverse discrimination.” Rather than ignoring such beliefs (and sometimes accusations), we need to explain and make clear that we are working towards equity, and how and why equity differs from equality. What may appear to be preferential treatment, is simply an attempt to “level the playing field” and to undo errors of the past (and, all too often, of the present). We should make clear that our final objective is for all of our students to achieve their mathematical goals, and that equity is an important step to this end. (This picture is from the Interaction Institute for Social Change; the artist is Angus Maguire. I prefer, but don’t have rights to the version at https://www.scc.losrios.edu/equity/f-a-q/ .)
Most important, though, is the fact that we now have some data. It is far from perfect: some of the questions seemed poorly worded and the lack of the input from the individual interviews is frustrating. Although the data don’t paint a detailed picture, they do provide us with information beyond the anecdotal. This snapshot of the AMS members’ workplace experiences, though far from complete, is enlightening and useful. I want to thank all of the AMS members who took part in this study.
I am looking forward to the researchers’ final report(s), drawing together the input from members of a wide range of STEM professional organizations. All too often, mathematics is left out of STEM-focused studies and programs. It’s good to know that members of both the AMS and the MAA (possibly along with other mathematics organizations) have made sure that mathematics is being well-represented in this national study.