
Source: TED.com
This time of year, a new crop of math majors are stepping off college campuses and into the next phases of their lives. Some go to industry, some into teaching, and some into graduate school. Along any of these paths, one way to continue learning is to watch talks about and using mathematics from the internet, including sources such as TED.com and Vi Hart’s YouTube Chanel. Sadly, many of these talks leave a junior mathematician wanting more. In this post, you will find a sequence of interesting math talks that have been extended by further literature research by graduating seniors for your continued edification. Enjoy!
The internet awaits.
Table of Contents: (Titles are jump-links)
- The math and magic of origami (Guest Author: Jake Gaier)
- Peter Donnelly: Shows how stats fool juries (Guest Author: Jerod Bernicky)
- Why Smart Statistics are the Key to Fighting Crime (Guest Author: Johnathan Burch)
- Fractals and Roughness (Guest Author: Benjamin Knapper)
- Algorithmic Architecture (Guest Author: Logan Kruse)
- Applying Fractal Geometry to Antenna Design (Guest Author: Kevin Hodge)
- Approaching Complex Problems Using Large Scale Estimation (Guest Author: Grant Halter)
- Questions in Response to Sean Gourley’s: The Mathematics of War (Guest Author: Erik Westerberg)
- Stock Market Indicators (Guest Author: Sean Mulholland)
- Mathematical Music (Guest Author: Natalie Viscariello)
- Identifying Parkinson’s Disease Through a Phone Call (Guest Author: Nick Tenerelli)
- Andrew Ng: Neural Networks and Machine Learning (Guest Author: Cooper Melgreen)
- Fibonacci Numbers (Guest Author: Jonathan Waite)
- Hyperbolic Planes Made from Balloons and Crocheting? (Guest Author: Sara Fitzgerald)
- The Algorithmic Stock Exchange Takeover (Guest Author: Isaac Trostle)
- Are Cities and Corporations Structured by Math? (Guest Author: Tyler Busch)
- Modeling London Rioters and Human Behavior (Guest Author: Jay Graffagna)
- Finding Large Primes (Guest Author: Jim Trainor)
~
The math and magic of origami
Guest Author: Jake Gaier
Japanese origami artists showed us how beautiful and fun folding paper can be. There’s a certain charm to folding a flat monochrome square into a crane, a samurai helmet, or even a three-headed dragon (link below). Robert Lang shows us how to further that ancient art and make shapes even more extraordinary than that dragon. He explains that by using concepts in disk packing, graph theory, and tree theory, we can create almost any 3-D shape imaginable. But making fancy paper decorations for place settings (a common Japanese practice) is not enough for Lang; he wants to save lives. He goes on to show that these same origami techniques are useful in folding large things (such as huge telescopes, airbags, and bodily implants) into smaller things so they can fit inside spaceships, steering wheels, and arteries.
Lang’s talk is meant to introduce an average viewer to the possibilities of mathematics within origami, which he does very well. It is somewhat frustrating to the mathematician within me that he does not give a more detailed description of how some of the math behind it works. Despite the frustration, I understand that going into more detail would likely bore an audience, take too much time, and make the purpose of his talk slightly less clear.
Within this talk, Lang does not, however, move past the bounds of traditional origami. One particularly exciting idea is called the one-cut problem. Given a shape on a flat piece of paper, is it possible to fold that paper and make one complete cut such that you cut along the shape and nothing else? Lang mentions and demonstrates this in other talks, but Erik Demaine has a lecture on this very topic. He proves that any set of line segments (not just polygons!) can be cut like this. He gives two methods to doing this: the familiar disk-packing method and a method of his own design called the straight skeleton method. The straight skeleton is (relatively) easy to do, but actually only works most of the time. The disk packing method works all the time, but is much less practical for a human or computer to do.
The straight skeleton method relies on making angular bisecting folds to each of the cut lines. If you do just that, you’ll likely end up with a shape that cannot be lain flat, so you have to also fold the paper the other way with perpendicular bisectors. See Demaine’s straight skeleton method in action in the video: http://courses.csail.mit.edu/6.849/fall10/lectures/L07.html.

Source: http://www.happyfolding.com/gallery-montroll-three_headed_dragon
~
Peter Donnelly: Shows how stats fool juries
Guest Author: Jerod Bernicky
In this talk Donnelly brings to light some thought provoking elements of standard statistics that most people don’t consider. He shows us that most peoples’ intuition and understanding about uncertainty just isn’t good. He brings up the heads and tails example and the AIDS example. Most people intuitively only look at one side of the statistics because they are unfamiliar with it.
This isn’t a new thing to the general public. This same sort of thinking applies itself to some other famous probability problems. The Monty Hall problem deals with 3 doors, if you pick a door your chance of getting the good prize behind it is 1/3. However if someone reveals another door to be false and gives you the option to switch the doors should you switch? In other words, is the probability higher than the original 1/3 that you’ll get a prize out of the third door? Most people would say no, that the probabilities are the same. But that is in fact false because since you’re removing a door from the equation you have more information and therefor the probability is higher. In fact it increases to 2/3.

Source: http://i1.ytimg.com/vi/mhlc7peGlGg/hqdefault.jpg
Only looking at one side of the problem continues in the Birthday paradox. How many people need to enter a room in order for two people to share a birthday. Intuitively you would probably think a lot. But as more people enter, the probability of two people not having the same decreases every time. This tends to drown out the intuitive 1/365 mentality.
This mindset doesn’t affect just affect the general public. Even doctors struggle with trying to grasp uncertainty. 25 doctors were given a quiz and on the quiz there was a question similar to the aids question during Donnelly’s talk. “Imagine a hypothetical baseball player. Call him Alex. He fails a drug test that is known to be 95 percent accurate. How likely is it that he is really guilty?” The standard answer would be a simple 95% but it’s not right for the same reason that the AIDS question wasn’t right. You have to take into account the false positives. Only 6 of the 25 doctors got it right.
Now where does this leave us? The previous article suggests that higher level statistics should be included in graduate studies, but that will only help so much. This thinking is widespread and affects more than just doctors. Statistics are abused all the time in order to shape people to think a certain way. We just need to spread the word that these sort of statistics are not what they appear to be.
Sources:
Kaye, David H. “Beyond Uniqueness: The Birthday Paradox, Source Attribution and Individualization in Forensic Science Testimony.” Beyond Uniqueness: The Birthday Paradox, Source Attribution and Individualization in Forensic Science Testimony. Oxford University Press, 5 Nov. 2009. Web. 28 Mar. 2014.
Siegfried, Tom. “Doctors Flunk Quiz on Screening-test Math.” Science News. N.p., 22 Apr. 2014. Web. 28 Mar. 2014.
Sprenger, Jan. “Probability, Rational Single-case Decisions and the Monty Hall Problem.” JSTOR. Springer, June 2010. Web. 28 Mar. 2014.
~
Why Smart Statistics are the Key to Fighting Crime
Guest Author: Johnathan Burch
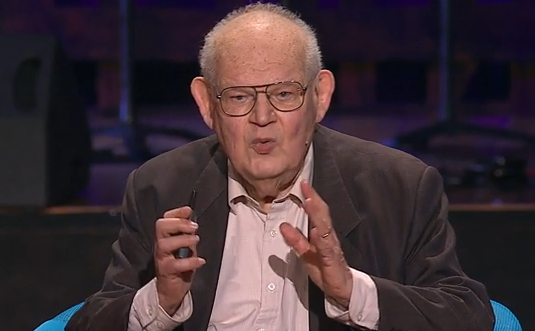
Anne Milgram gave a great TED talk lecture on why smart statistics are the key to fighting crime (you can view her video here). Her journey began when Milgram became the attorney general of New Jersey in 2007 in which she asked herself a few very simple and basic questions. They were: Who we were arresting, who we were charging, and who we were putting in our nation’s jails and are we making decisions in a way that is making us safer. Because nobody could ask these seemingly simple questions, Milgram went out on her own to find these answers.
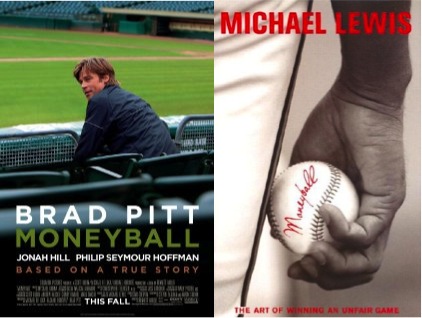
In the end she found that most of the arrests involved low level drug cases. Not only that, but the police force was fighting crime by putting yellow sticky notes on a board. They were using just their intuition, not data. Milgram quickly added data analysis, smart data, and statistics into criminal justice. For example, Milgram and Governor Cozine worked with the U.S. Bureau of Alcohol, Tobacco, Firearms, and Explosives to allow the state to track illegal firearms with an electronic tracking system. Instead of focusing on low level drug cases, the police force worked on bigger crimes such as violence, gun trafficking, and political corruption. The end result: murder dropped 41 percent and all crime dropped 26 percent. Her new system has been connected to the book turned movie Moneyball which is about a baseball team that used smart statistics to create an unconventional yet winning ball club.
Milgram was still not satisfied and moved into the court system. After some research she concluded that 2/3 of those in jail are awaiting trial and that 67% come back in jail after being set free. Similarly to the police officers, court judges were making their decisions based off of intuition and experience. There is no data for judges to make their decisions. Only about 5-10% of them use a data assessment tool to help their decision making. The reason being is that they are expensive, difficult to use, or not very reliable. Milgram aspires to fix this problem by putting together a team of individuals to create an assessment tool that would solve all of those problems. With a few basic questions a judge can quickly and easily have information to base their decision off of. Of course she is not saying she wants to replace judges with computers, but believes that date plus instincts will yield the best results.
Sources:
FAIRFAX JR., ROGER A. “The “Smart On Crime” Prosecutor.”Georgetown Journal Of Legal Ethics 25.4 (2012): 905-912.Academic Search Premier. Web. 5 May 2014
Vito, Anothny G., and Gennaro F. Vito. “Lessons for Policing from Moneyball: The Views of Police Managers – A Research Note.” American Journal of Criminal Justice 38.2 (2013): 236-44. Web. 2 May 2014.
Images:
Moneyball image: http://www.impact.upenn.edu/blog/page/moneyball_philanthropy_back_to_school_film_review_by_jennifer_landres
Anne Milgram Picture: http://img.tedcdn.com/r/images.ted.com/images/ted/3e820be716ef041e7bd7792bbfc5b5753d4e0dbf_1600x1200.jpg?ll=1&quality=89&w=800
~
Fractals and Roughness
Guest Author: Benjamin Knapper
Benoit Mandelbrot’s TED talk titled Fractals and the art of roughness is an engaging and interesting talk that introduces the basic ideas of roughness. I will start by defining fractal, according to the McGraw Hill Encyclopedia of Science and Technology a fractals are “Geometrical objects that are self-similar under a change of scale, for example, magnification”. I will start by saying that according to this definition the Mandelbrot set is not a fractal. Although the Mandelbrot set has repeated ideas, the patterns are not self-similar and are not the same under magnification. This is further proved in an article titled Calculation of the Structure of a Shrub in the Mandelbrot Set. Discrete Dynamics In Nature & Society by Pastor, Romera, Orue, Martín, Danca, and Montoya.

The article examines the differences in some of the repeated patterns found within the Mandelbrot set. Although the Mandelbrot set is not a fractal it does have roughness.
Roughness is easy for the human eye to distinguish. An easy example to explain roughness is to compare a pool ball and a golf ball. Pool balls have almost no roughness, the surface of the ball is extremely smooth or without detail. A golf ball has more roughness due to the dimples, which are detectable by the eye or touch. During the talk Mandelbrot presents a specific number used to determine roughness. The way in which he presents the number, D, makes it seem as if the number is simply put into a computer program to vary the degree of roughness rendered in a picture. Computers are perfect for rendering roughness due to their ability to compute a simple algorithm many times. The final thing Mandelbrot says in his presentation is that “bottomless wonders spring from simple rules, which are repeated without end”.
This closing quote really gets at what the entire presentation is touching on. It doesn’t take an extremely complex equation to create complex figures with high degrees of roughness. The human lung is another example of extreme roughness, and can be seen across different species as a whale’s lungs, a human’s lungs, and a mouse’s lungs all show a similar degree of roughness. They are simply limited by the space they have to fill. The Mandelbrot set simply comes from the recursive equation z->z2 + c, yet the set goes on infinitely and creates spectacular shapes and formations that would seem the most complex equation could not produce. Complex equations are needed to explain the roughness of something that was created with just a small simple function. This can be seen in A simple fractal analysis method of the surface roughness by Jahn and Truckenbrodt.
Below is a picture of the Mandelbrot set zoomed into a particular point and colored that again shows the idea that “bottomless wonders spring from simple rules, which are repeated without end”.

Source: Wikimedia Commons
Works Cited:
Pietronero, L. (2012) Fractals In Encyclopedia of Science & Technology. (11th ed., Vol 7, pp. 532-534). McGraw-Hill, New York.
Pastor, G. G., Romera, M. M., Orue, A. B., Martín, A. A., Danca, M. F., & Montoya, F. F. (2011). Calculation of the Structure of a Shrub in the Mandelbrot Set. Discrete Dynamics In Nature & Society, 1-23. doi:10.1155/2011/837262
Jahn, R. R., & Truckenbrodt, H. H. (2004). A simple fractal analysis method of the surface roughness. Journal Of Materials Processing Technology, 145(1), 40. doi:10.1016/S0924-0136(03)00860-4
~
Algorithmic Architecture
Guest Author: Logan Kruse
In his TED presentation entitled Building Unimaginable Shapes, Michael Hansmeyer displays incredible shapes and explains the motivation and methodology he used to create the shapes. Hansmeyer starts by asking the audience what shapes could we create without any references, biases, and preconceptions. He said the answer to this was to start by looking to nature, which he calls the greatest architect of form, and borrowing nature’s processes and abstracting them. Hansmeyer used the example of Morphogenesis, the splitting of two cells into either identical or distinct cells, then abstracted into folding a surface into two surfaces. The surfaces would either be unique or distinct. This idea was then coded as an algorithm into a computer to be able to fold on a 3D structure controlling the folds ratio and allowing the computer to fold given your specified ratio, using those rules alone. The shapes that were created were incredible with endless detail. He believes that by designing a process versus designing an object, we can create any shape.

On Michael Hansmeyer’s website, he provides a video that looks more deeply into the procedure. The surfaces are divided into a huge number of subdivisions that successively divides the shape into smaller surfaces. The division ration changes the outcome of the shape. With the endless possibilities of division ratios, and endless number of shapes with endless detail can be created. One problem he did mention was rendering. Hansmeyer created a column using 1mm sheets of laser cut plastic to build column, but even that small of a scale may not be capturing all of the detail that is included in the form.
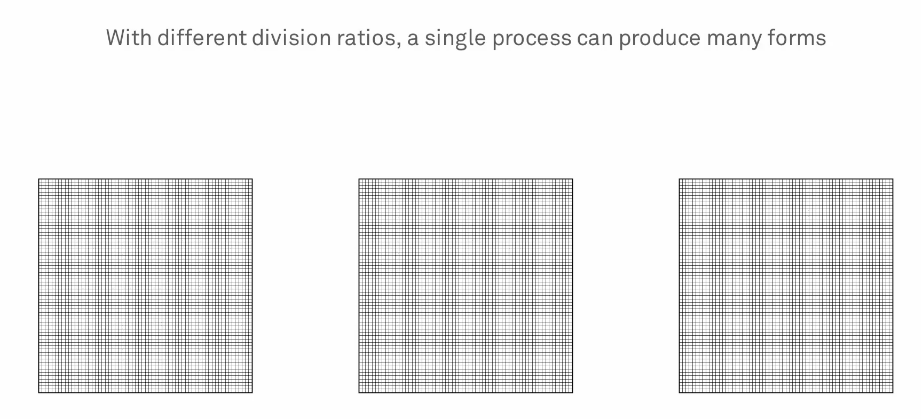

The inspiration and designs are similar to the works of Antoni Gaudi. Gaudi was inspired by organic geometry and many of the forms resemble parts of what Hansmeyer was creating, but obviously not to the detail that a computer could create in seconds. Gaudi was bound by more realistic rules than Hansmeyer because he couldn’t allow the surfaces to interact in any way they wanted, while surfaces in Hansmeyer’s algorithm could intersect each other. This allows Hansmeyer to create shapes that are truly unimaginable because they are bound by only subdivisions and division ratios.
Works Cited:
Brown, Cameron. “Gaudí’s organic geometry.” Computers & Graphics. Volume 32, Issue 1. February 2008. Pages 105-115. Web. 25 Apr. 2014
Hansmeyer, Michael. “Building Unimaginable Shapes.” TEDGlobal 2012. June 2012. TED. Web. 25 Apr. 2014.
Hansmeyer, Michael. “Subdivided Columns.” Computational Architecture: Subdivided Columns. 2010. Web. 25 Apr. 2014.
Images:
Hansmeyer, Michael. “Subdivided Columns.” Computational Architecture: Subdivided Columns. 2010. Web. 25 Apr. 2014.
Hansmeyer, Michael. “Platonic Solids.” >Computational Architecture: Subdivided Columns. 2010. Web. 25 Apr. 2014.
~
Applying Fractal Geometry to Antenna Design
Guest Author: Kevin Hodge
Fractal Geometry has always been an interesting mathematical topic, but now it is being applied to real world situations. The idea of a “fractal tree” has been used in the design of antennas, in order to optimize effectiveness. According to the research completed, antennas that follow this snowflake/tree style of fractal design were found to increase radiation efficiency by 6.87% and increase antenna efficiency by 2.57% as compared to tree design antennas of similar dimension. The fractal tree is a design based off of the Koch Snowflake being integrated into the binary fractal tree design. Due to the dimension similarity of the antenna tests, this data shows that using the fractal design will in fact increase antenna efficiency, without requiring more space for the antenna.
Fractal Tree Antenna designs


Original Koch Snowflake

With these images the self-repeating fractal design is apparent in the fractal trees, and the second tree design show the integration of the snowflake into the fractal tree in an actual antenna. Image 3 also shows how the fractal antenna utilizes a large transmission area (surface area of the wire is large), while not requiring an extensive area for the antenna to be placed in.
In addition to the antenna application, there has also been research into applying the Koch Snowflake in the cooling surfaces of electronic devices. Just like having a snowflake fractal antenna, a cell phone could also have fractal geometry implemented to help cool the device faster. In the research the self-similar design of the fractal was applied to heat diffusion plates so that heat transfer would be improved.
Fractal geometry can be used to increase the efficiency in electronic devices, by applying the design to elements of the device such as the antenna and cooling areas, however, this type of research opens the door to exploring many different areas that fractal design could be used. Utilizing repeating, self-similar designs, efficiency of any sort of transmitting and receiving device could be improved.
Sources:
RAMŠAK, Matjaz, and Leopold ŠKERGET. “Heat Diffusion In Fractal Geometry Cooling Surface.” Thermal Science 16.4 (2012): 955-968.Academic Search Premier. Web. 25 Apr. 2014
Rani, Shweta, and A.P. Singh. “Design And Optimization Of New Hybrid Fractal Tree Antenna.” International Journal Of Applied Electromagnetics & Mechanics 43.4 (2013): 403-415. Academic Search Premier. Web. 25 Apr. 2014
Image Sources:
1:http://en.wikipedia.org/wiki/H_tree
2:http://www.math.ubc.ca/~cass/courses/m308-03b/projects-03b/skinner/ex-dimension-koch_snowflake.htm
3:http://www.m0wwa.co.uk/mmedia/fractal_antenna/fractalantenna.jpg
~
Approaching Complex Problems Using Large Scale Estimation
Guest Author: Grant Halter
In his thought-provoking Ted-Ed video, Michael Mitchell addresses the concept of rapid estimation through Fermi problems and the basics in how to approach questions that initially seem unsolvable. The video demonstrates the classic example that asks, “how many piano tuners are in Chicago?” By balancing rough over- and under-estimates, an accurate guess can be obtained that brings you to the same order of magnitude as the real answer. This is not used to find the exact answer, but more simply to gauge the feasibility of a problem and how to go about answering difficult questions. This idea can be utilized at a higher level of math by applying it to mathematical model prediction to help focus the beginning steps when answering a complex problem.
The goal of producing an accurate estimate from a Fermi problem relies on the ability of the individual to breakdown the seemingly intimidating problem into small, more manageable pieces. This helps guide you through the process before breaking ground on the data. Answering several small problems can be much more encouraging than figuring out where to start with a single massive one.
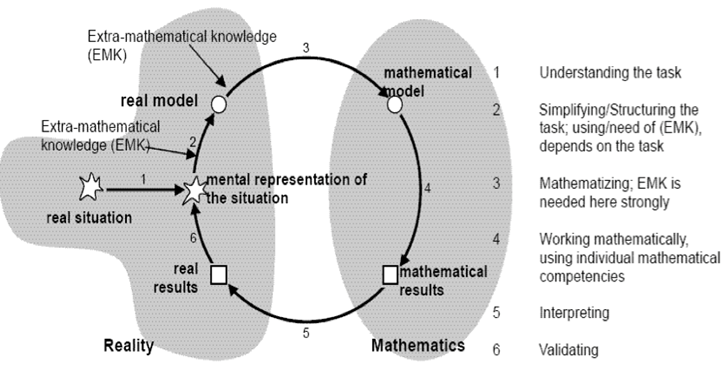
The diagram below shows one perspective of the entire mathematical modeling process for problem solving. The process is described in terms of six phases: real situation, mental representation of the situation, real model, mathematical model, mathematical result, and real results. Transition zones connect the six phases and are called: understanding the task, simplifying/structuring the task, mathematizing, working mathematically, interpreting and validating. The diagram helps visualize the modeling process in a more linear way along a timeline that allows students to represent and contribute to a dialectic progression towards a solution to the problem.
To generally apply this idea to any level of mathematics, you can use this when comparing a model to the real world. When you build a model you have to be selective by concentrating on certain features from the real world that are either relevant or irrelevant to the model. Your trimmed-down model now allows you to focus on the problem and evaluate it. If you fail to recognize why your model is significant then you will not be able to effectively communicate it in a meaningful way. By calling from a method grounded in theory, upper level students can insert a personalized level of complexity into the process that will allow them to approach the data and apply it.
Sources:
Bergman, Jonas, and Christer Bergsten. “On the Use of Realistic Fermi Problems in Introducing Mathematical Modelling in Upper Secondary Mathematics.” Linkopings Universtity, 22 Oct. 2013. Web. 4 Apr. 2014.
Gleeson, Austin. “Fermi Problems.” FERMI PROBLEMS. University of Texas Physics, 31 Aug. 1995. Web. 28 Mar. 2014.
Angier, Natalie. “The Biggest of Puzzles Brought Down to Size.” The New York Times[New York] 31 Mar. 2009, New York ed., D2 sec.: n. pag. The New York Times. 30 Mar. 2009. Web. 26 Mar. 2014.
A.M.Starfield, K.A. Smith, A.L. Bleloch: “How to Model it; Problem Solving for the Computer Age”, McGraw-Hill, 1990. http://www.engr.sjsu.edu/nikos/courses/engr10/pdf/pingpong.pdf
~
Questions in Response to Sean Gourley’s The Mathematics of War
Guest Author: Erik Westerberg
In Sean Gourley’s talked titled The Mathematics of War, he describes in depth how mathematical trends exist between the frequency of violent acts and the intensity of those acts throughout a variety of modern conflicts. Gourley and his team used their knowledge of statistics, mathematical trends, and differential equations to analyze recorded data from government documents, media 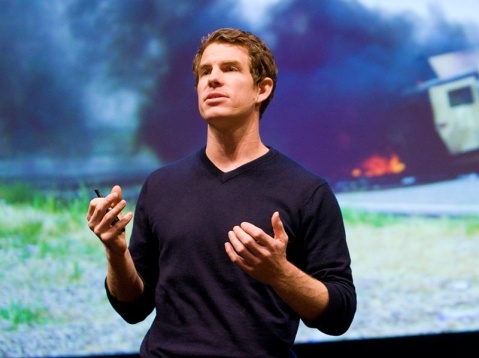 sources, NGO’s, and other sources. From their equation deriving, Gourley’s team has been able to predict future behavior of attacks based off the frequency and intensity of violent acts in a variety of modern conflicts (Gourley). When watching this video through a mathematical lens my attention was caught instantaneously. I found it fascinating that war is something that can be described and predicted using mathematical tools.
In an interview of Gourley on his talk, he described further that his team found that, “attacks are not randomly distributed across a conflict; instead, they tend to cluster together. The cause of this clustering is coordination via a global signal and competition amongst groups for media exposure and resources” (Trost). From this sort of claim, Gourley and his team are identifying a universal behavior that can predict attack patterns from a variety of insurgent groups. This claim sits at the core of Gourley and his team’s research.
The route that Gourley and his team have taken to attain these results and make these claims is from collecting the available documents that describe the different attacks that occur in modern conflicts. Within these documents, the number of deaths are then determined and this value is the variable that has been focused on for data interpretation (Gourley). From this sort of method, the question needs to be asked about whether or not simply the pattern of documentation of deaths in attacks causes the trends that Gourley and his team have seen. Nonetheless, patterns have been noticed.
An alternative method to collecting data about violent attacks in modern conflict is by analyzing the cost of damage violent attacks cause versus the number of deaths. Gourley states in his interview, “one proxy for attacks on infrastructure might be the dollar value, or the ‘cost’ of the damage. Another way of capturing non-casualty information might be to analyze the media 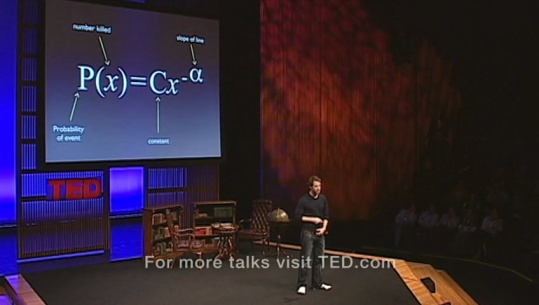 coverage generated by an attack. By tracking the ‘cost’ or ‘publicity’ metrics, we might find even more statistical patterns that can tell us new things about the insurgent ecosystem” (Trost). Taking this route can help answer a lot of questions about the definition of the intensity of a violent attack. Could it be that the intensity of a violent attack should not be solely measured by the amount of casualties but rather by the amount of deaths that occur along with the amount of damage in dollars that is caused by an attack? This would then mean that a dollar value may need to be placed on the value of a human life which brings up a whole other collection of moral issues.
The results that Gourley and his team have come with have been described in his talk and his interview to be useful in predicting attacks within modern conflicts and specifically modern conflicts where an insurgent force exists. He notes that the patterns he and his team have discovered do not apply to wars such as the American Revolution but how about a conflict such as the Vietnam War. There was a clear insurgent force in the Viet Cong that existed during this conflict. Gourley mentions the analysis of insurgencies in a variety of different geographical areas in recent years but makes no mention of the Vietnam War which is a notable conflict in which a significant insurgent force existed. It makes me wonder whether or not the distributions and patterns Gourley and his team have come up with, would apply to one of the most devastating wars in our country’s history.
In terms of Gourley’s mentioning of how his models can be used to predict future behavior in his talk, a question does arise. In his published writing in Nature, he states, “we can use the model to look for early signs of a potential war or insurgency. Or, we can track the fundamental signatures of conflict in real time to see how likely a war is to end within the next 12 months”  (2). However, Gourley provides an example in his talk about the insurgency patterns in Iraq being very unpredictable. The conclusion must be that it is much more difficult to predict insurgent behaviors at the micro level versus at a global level as shown in the example he gave about Iraq in his talk. This also must have been what he meant in his interview when he stated, “how likely a war is to end”, which refers to the more global patterns of attacks in war versus the pattern of singular attacks.
To add, Gourley frequently notes how these patterns of behavior, “are independent of political, religious, geographic or ideological differences” (Trost). However, in a variety of different studies done on insurgent behaviors, ideology seems to play a significant role in the behaviors and patterns of behavior of insurgent forces. In Alec Worsnop’s study titled, Not all Fragmentation is Equal: Insurgent Organizational Structure and Control of Collective Violence, he notes that the leadership of an insurgent force weighs heavily on the behavior of that particular force (Gabbay) Ideology of an insurgent force is reflected through its leadership. To add, Michael Gabbay and Ashley Thirkill’s study, A Quantitative Analysis of Insurgent Frames, Claims, and Networks in Iraq, mentions a similar thought that the direction and goals of insurgent groups, particularly in Iraq, makes insurgent behavior a very complex concept to predict and generalize. These scholars write that, “insurgent cohesion and dissension can be devised on the basis of conflict frames and targeting policy” (Worsnop). From this we can take that if the goals of insurgent groups are identified then their behavior can be more clearly predicted. However, in this study it is also noted goals of insurgent groups are hard to generalize on a larger scale which contradicts Gourley’s work.
The mathematics involved in making the claims that Gourley and his team have made is no less than amazing but with such a complex concept such as insurgent behavior in modern conflict, questions need to be asked that he and his team may not have wholeheartedly addressed yet.
Works Cited:
Bohorquez, Juan Camilo, Sean Gourley, Alexander R. Dixon, Michael Spaget, and Neil F. Johnson. “Common Ecology Quantifies Human Insurgency.” Nature. Nature, 29 Oct. 2009. Web. 3 Apr. 2014.
Gabbay, Michael and Thirkill-Mackelprang, Ashley, A Quantitative Analysis of Insurgent Frames, Claims, and Networks in Iraq (2011). APSA 2011 Annual Meeting Paper.
Gourley, Sean. Nature. Digital Image. TED Blog TED Fellow Sean Gourley Published in Nature Comments. N.p., n.d. Web. 22 Apr. 2014.
Gourley, Sean. TED. Digital Image. TED. N.p., n.d. Web. 22 Apr. 2014.
Gourley, Sean. TED Ideas Worth Inspiring. Digital Image. TED. N.p., n.d. Web. 22 Apr. 2014.
Gourley, Sean. “The Mathematics of War.” Sean Gourley:. TED, Feb. 2009. Web. 2 Apr. 2014.
Trost, Matthew. “TED Blog.” TED Blog TED Fellow Sean Gourley Published In Nature Comments. TED, 16 Dec. 2009. Web. 3 Apr. 2014.
Worsnop, Alec, Not All Fragmentation is Equal: Insurgent Organizational Structure and Control of Collective Violence (April 5, 2013) MIT Political Science Department Research Paper No. 2013-18.
~
Stock Market Indicators
Guest Author: Sean Mulholland
Being a senior in college, I have begun to truly realize the importance of money. As a senior in college who starts a full-time job in the Fall, I have realized that I need to learn how to properly invest my money now that I will have a steady income. The stock market is a great start. The issue with the stock market is the risk involved in investing. You never know when the stock market will rise and when it will fall.
A great start to working the stock market is to know some possible signs of when the stock market may rise after purchasing stock. As discussed by Arvydas Jadevicius within the video linked at https://www.youtube.com/watch?v=RbH78AhvuU8, there are very logical reasons as to why something as simple as the length of women’s skirts would indicate the success of the stock market. There is discrete evidence that trends in the way we shop and the way popular culture effects shake out are strong indicators for the growth and decline of the stock market. Having information like this may be a great way to shake things up on how you are purchasing stocks and could even lead to some great short term investments.
Many investors will tell you to stick with stocks for the long term. As discussed at Learnvest, there is potential for great gains throughout time. This involves large company stock gains rising an average of 10% and smaller stock gains rising an average of 12% throughout the last 85 years. The problem as a new student is a lack of savings in case the stock drops. This means I need to figure out some of the indicators that can show if the market will rise or fall right after buying.

Most people would consider monetary reasoning for why the stock market rises but there are several indicators most people would never consider. Both CNBC and Kiplinger go into great detail of the different odd indicators of the stock market. These indicators range from the Super Bowl champion indicators to the Big Mac effect. To give a specific idea of what these indicators mean to the stock market, we will look at sort of a humorous example of how these indicators can be used. The sale of aspirin has shown trends in the stock market. We associate aspirin with headaches so it has been shown that higher sales of aspirin may indicate that the stock market is down (hence more headaches). There are several more indicators like this which may help us end up with more money in our pockets.
https://www.youtube.com/watch?v=RbH78AhvuU8
http://www.kiplinger.com/article/investing/T038-C000-S002-6-key-stock-market-indicators-to-watch.html
http://www.cnbc.com/id/29257460/page/1
http://www.learnvest.com/knowledge-center/returns-to-expect-when-investing/
http://www.ritholtz.com/blog/2011/01/long-term-stock-market-growth-1871-2010/?utm_source=feedburner&utm_medium=feed&utm_campaign=Feed%3A+TheBigPicture+(The+Big+Picture)
~
Mathematical Music
Guest Author: Natalie Viscariello
Scott Rickard’s TEDxMIA talk entitled “The Beautiful Math Behind the Ugliest Music” discusses the ideas of the mathematicians John Costas and Solomon Golomb. Rickard believes that beauty is found in repetition; Beethoven’s fifth is grounded in a motif that Rickard believes makes it distinctly beautiful. Absence of pattern, therefore, will create unappealing music. He uses the ideas of repetition, expectation, and perception of musical beauty to introduce what he calls the world’s ugliest music. He calls it “music only a mathematician could write.”
The undertaking of creating something random, without pattern, seems easy. However, humans are especially bad at this task. The Drunkard’s Walk by Leonard Mlodinow goes into detail about randomness in our lives, but essentially we see patterns where there is randomness, and we think that we’ve avoided patterns when we haven’t. Asking a human to create a repetition-free piano sonata would result in repetition of notes or rhythms, or some regularity in intervals. The navy engineer John Costas didn’t have quite as complicated of a problem from the beginning, but his work was the basis of Rickard’s sonata. Costas was working with sonar pings, and found a way to create a random pattern of sound, where each pair of notes has a different relationship that is never repeated.
Costas’ theory draws on Golomb rulers. Essentially, a Golomb ruler has markings such that one distance cannot be measured in two ways. On your typical ruler, you have markings for every inch. You can measure 1 inch by going from the 1 mark to 2, 2 to 3, 3 to 4, and so on. You can measure 11 inches by going from 0 to 11, or 1 to 12. So, there are several ways to obtain the same measurement. The Golomb ruler has integer markings such that you can measure a distance in only one way; each distance between pairs of markings is unique.
A Costas Array, as Costas’ discovery is now called, makes use of this in two dimensions. Instead of points on a line, there are n points on a square grid with 1 point in each row and column, and the displacement vector between each point is unique.
Rickard applied this to 88 points for the 88 keys on a piano, and mapped them to notes. He used a Golomb ruler temporally to eliminate repetition in time as well as pitch. The performance is what he calls the world’s ugliest piece of music. However, reading the comments posted on this video reveal that people appear to hear patterns. Though the music is mathematically free of repetition, assuming the pianist’s perfection, there is variance in what listeners heard. Neuroscientists Motz, Erickson, and Hetrick have performed studies on perception of rhythm that may explain. They found that rhythmic biases may exist, essentially meaning that changes to the expected, normal rhythm structure are often misheard to conform.
Of course, this isn’t the first attempt to apply mathematics to music. RC Read studied combinatorics and music, especially making use of tone rows, developed by the 20th century composer Schoenberg. Schoenberg developed 12-tone composition and tone rows. Essentially, his compositions involved orderings of the 12 pitches in an octave as a row, and transformations of that row. Along with Read’s work, this has inspired other musical mathematicians, such as DJ Hunter and PT von Hippel in their investigation of shared properties of 12-tone compositions of Schoenberg and his contemporaries. Rickard’s approach to mathematically interesting musical compositions adds to this conversation between two seemingly incompatible fields. Both Scheonberg and Rickard challenge the process of composition and the definition of musical beauty.
Hunger DJ, von Hippel PT. “ How Rare Is Symmetry in Musical 12-Tone Rows?” The American Mathematical Monthly. 100.2. Feb. 2003. Web. 24 Apr. 2014.
Mlodinow, Leonard. (2009) “The Drunkard’s Walk: How Randomness Rules Our Lives,” Random House, Inc., New York.
Motz BA, Erickson MA, Hetrick WP. “To the beat of your own drum: Cortical regularization of non-integer ratio rhythms toward metrical patterns,” Brain and Cognition. Feb 2013. Web. 26 Apr. 2014.
Read RC. “Combinatorial problems in the theory of music.” Discrete Mathematics. Jan 1996. Web. 24 Apr. 2014.
Rickard, Scott. “The beautiful math behind the ugliest music.” TEDxMIA. Sep 2011 TED. Web. 25 Apr. 2014.
Weisstein, Eric W. “Golomb Ruler.” From MathWorld-A Wolfram Web Resource. http://mathworld.wolfram.com/GolombRuler.html
~
Identifying Parkinson’s Disease Through a Phone Call
Guest Author: Nick Tenerelli

It is widely accepted that modern science relies heavily on math. Biologist, engineers, and chemists all use advanced mathematics to make their lives easier. However, one area that math seemingly has not be able to penetrate is in individual checkups with your doctor. Max Little, a mathematician with a background in signal processing, and his team are attempting to have a math related idea replace doctor visits for a specific disease. They have found a way to predict Parkinson’s Disease symptoms in people using a signal processor only by hearing their voice.
Little’s team is able to successfully diagnose a patient with Parkinson’s disease over the phone, which removes any need for actually stepping foot inside a doctor’s office. As mentioned in Little’s TED talk[2], the team used signal processing algorithms to highlight specific aspects of a person’s speech that are typically seen from patients with Parkinson’s Disease. The specific aspects of speech that are focused on are long vowel sounds, such as “ahh…”. Dysphonia, disorders of the voice, are noted during the phone call with the patient. For example, jitters and shimmers are typical elements that disturb the vocal fold cycles. The algorithm is able to pick up on these disturbances and note the dysphonia.
When Little’s algorithm was tested, it passed with flying colors. With a control database containing 132 dysphonia measures from 43 subjects, the patients were correctly diagnosed 99% of the time. The control contained 17 female, 6 healthy and 11 with Parkinson’s, and 26 male, 4 healthy and 22 with Parkinson’s. This 99% success rate outperforms state of the art results. In fact, this reported rate was only using 10 dysphonia features. [3]
The next big question is what is the next step. During Little’s TED talk, he mentioned that his team was able to achieve the same accuracy as noted above during calls that come from mobile devices. This is another large step in the direction towards non-invasive diagnostic health support. Anything that can aid people in receiving quick and accurate diagnoses about potential health concerns is something that our society needs. Like most diseases, treating Parkinson’s disease becomes easier when it is identified in its earlier stages. A simple phone call may be easier to do than scheduling and attending a doctor’s appointment. Little and his team have possibly created a new, better, way to diagnose Parkinson’s Disease, and math was a large part of it.
References:
[1] http://whatsnext.blogs.cnn.com/2012/11/27/max-little-detecting-parkinsons-by-the-sound-of-a-voice/
[2] https://www.ted.com/talks/max_little_a_test_for_parkinson_s_with_a_phone_call
[3] http://eprints.aston.ac.uk/18329/1/Novel_speech_signal_processing_algorithms.pdf
~
Andrew Ng: Neural Networks and Machine Learning
Guest Author: Cooper Melgreen
What do Siri, Microsoft Kinect, Google’s self driving cars, and automated medical diagnosis all have in common? Besides basically being from the future, they’re also examples artificial neural networks in action. Maybe you already know all about of artificial neural networks (often called ANNs, but you probably knew that too) and if so congratulations on knowing about something cool. For the rest of us, here’s presentation from 18 year old Brittany Wenger about how she won the 2012 Google Science Fair with an ANN that detects breast cancer: http://www.youtube.com/watch?v=AY4ajbu_G3k
She does a great job of showing how the sort of task that neural networks excel at, but unless you have photographic memory, you might have missed the slide around 3:02 where she shows the mathematics behind her work:

The point of this blog post is to dig a little deeper into what that all means and what happens inside an ANN, starting with…
ANN Structure
Neural networks are based on the way brains work. Each brain has billions of neurons connected to each other that are responsible for every sight, smell, sound, motion, and thought of that person. On an individual level, though, each neuron does essentially the same thing. It takes input from all of the neurons that connect to it decides whether or not to activate itself and pass its small piece of information on to the neurons it connects to. As these individual activations cascade throughout the brain, more information gets integrated into increasingly complex representations.
ANNs take this structure and model it mathematically for the purpose of machine learning. In the most basic form of an ANN, nodes of a graph are organized into layers that process information and pass it onto the next layer.

Typically, the whole network is only three layers. The first layer encodes the input into a series of values between 0 and 1. Nodes in the second layer receive some combination of input values to process and then pass the results onto the final, output layer which tells whatever the ANN has figured out.
One of the most interesting areas of ANN research is into deep networks. Even though they’ve only been around since 2006, deep networks have managed to kick-ass in almost every machine learning domain they’ve been applied to and hold a number of records for accuracy. They work on the same basic structure as any other network except that they have a larger number of hidden networks. The major breakthrough that occurred in 2006 that allowed deep networks make such incredible gains was the development of greedy layer-wise learning algorithms in which each layer takes the last slice of pizza without asking. Wait, no? Oh. It turns out that greedy only means that the backpropagation algorithm is run individually for each hidden layer. To understand what backpropagation is, we need understand exactly what each node does with the inputs it receives. This brings us to…
Summation and Activation Functions
Imagine that you could win a million dollars just by answering one true or false question. Now imagine that same scenario, but with two dozen people screaming what they think the answer is at you.

Everyone knows Asmara is the capital of Eritrea!
Nodes in an ANN are in a similar situation. They have to listen to every node that connects them and decide what to do. Of course some people are smarter than others and some nodes give more useful information. To model this, a node multiplies each input it receives by number called the weight that represents how much influence that particular input should have over the outcome. A higher weight means that connection exerts more influence. Weights can even be negative, meaning that it tries to stop activation. The node then takes all of these weighted inputs and adds them together to use in the activation function.

The activation function is just a logistic curve that models a binary output. As the sum of the weighted inputs becomes more positive the nodes activation approaches the value one. If the sum is more negative, activation approaches zero. This values is then passed on as input for nodes in the next layer which repeat the process.
If that’s all an ANN does you might be wondering where the learning part of machine learning comes from. Well get ready for the real meat of neural networks.
Backpropagation
Since there’s usually no way to tell what the connection weights in an ANN should be at the start, random values are used so that the network basically just guessing. If it gets the answer right, awesome! But the odds of that happening are pretty much zilch so there needs to be a way to change them. What happens is that when a wrong answer is given the network determines how wrong each connection was and changes them that much. Some connections get less influence while others get more.
I told you to go with Asmara!
Mathematically, backpropagation is equivalent to gradient descent over the networks error function. The formula to determine how much to adjust the weight of each connection actually uses the derivative of the activation function, which is why a logistic curve is used instead of a binary step function. The end goal is to improve the networks performance and make it just a bit better than it was before. To make real improvements the network has to run the backpropagation algorithm on thousands of examples.
You can watch as a a little car learns how to drive around a course to see it in action: https://www.youtube.com/watch?v=0Str0Rdkxxo
At first, its movements might as well be random. Slowly but steadily it becomes more coordinated and makes its way around the first corner, then the second, and finally all the way around the track. One youtube comment on that video joked that it was actually a training video for Google’s self driving cars. The cool thing about ANNs is that that’s almost true.
Sources
http://pages.cs.wisc.edu/~bolo/shipyard/neural/local.html
http://page.mi.fu-berlin.de/rojas/neural/chapter/K7.pdf
http://deeplearningworkshopnips2010.files.wordpress.com/2010/09/nips10-workshop-tutorial-final.pdf
http://www.molecular-cancer.com/content/4/1/29/figure/F3?highres=y
http://www.cs.bgu.ac.il/~icbv061/StudentProjects/ICBV061/ICBV-2006-1-TorIvry-ShaharMichal/index.php
http://www.epiceveryrep.com/your-workout-routine-why-it-sucksrocks/shouting/
~
Fibonacci Numbers
Guest Author: Jonathan Waite
1, 1, 2, 3, 5, 8, 13, …
The Fibonacci numbers are a very famous sequence of numbers. This sequence was first introduced to Western European mathematics in 1202 in the book Liber Abaci by Fibonacci. Prior to this, the sequence had been described in India.
I decided to base this post on the Fibonacci Numbers after watching the following TED Talk.
https://www.ted.com/talks/arthur_benjamin_the_magic_of_fibonacci_numbers
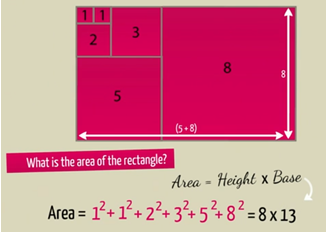
Part of this talk is dedicated to the understanding of why adding the squares of Fibonacci numbers starting from the beginning will end up giving you a number that is equal to two consecutive Fibonacci numbers multiplied together. This is shown by example by displaying the squared numbers as actual squares which when put together form a rectangle. I have included an image from the talk to illustrate. This also connects to the Golden Ratio by dividing the sides of the resulting rectangles as larger and larger Fibonacci numbers are used.
SOME OLD AND NEW RESULTS FOR THE WORLD’S MOST FAMOUS SEQUENCE OF NUMBERS by Thomas Dence
Journal of Applied Global Research – Volume 6, Issue 16 (2013), pp. 38-43
This short article lists out a few interesting properties of the Fibonacci numbers. One that I found particularly interesting was the Binet formula, which gives the value of the nth Fibonacci number.
The formula is 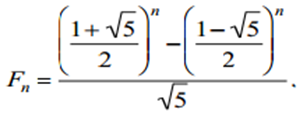
Using this we can show that the ratio of consecutive Fibonacci numbers converges to the golden ratio.
The article goes on to give a proof that the Millan series, which is defined as a specific series of Fibonacci reciprocals, converges to a specific irrational number.

Another interesting source about the Fibonacci numbers is The Fibonacci Quarterly.
This is a journal that started in 1963 and is all about the Fibonacci numbers and related mathematics. All of the issues from 1963 to 2007 are available online free of charge, and the more recent issues can be viewed with an active annual subscription. Included on the website are lists of various problems and solutions and which issue they are in. This is under the General Index header. Split between elementary and advanced topics, there are nearly two thousand individual problems. This also includes a few problems that do not yet have solutions which show that even after over 800 years there is still more to learn on this subject.
~
Hyperbolic Planes Made from Balloons and Crocheting?
Guest Author: Sara Fitzgerald
Mathematicians (Bolyai and Lobachevsky) have only recently discovered hyperbolic geometry in terms of the existence of Euclidean geometry. Because the parallel postulate does not exist in hyperbolic geometry like it does in Euclidean geometry, there are many differences between the two geometries (Mackenzie, 2002). Having a model to visualize the hyperbolic plane is beneficial for understanding hyperbolic geometry because it is difficult to imagine a plane where at every point the surface curves away from each other making it go on forever. I am sure you wished you had or enjoyed having a model of the plane when learning hyperbolic geometry, because it is unfamiliar to many people. The shape of the plane has to do with the negative Gaussian curvature in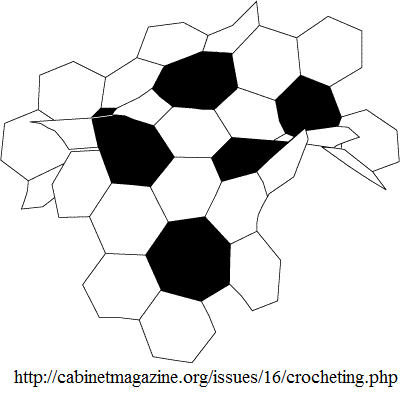 hyperbolic geometry. Take the original model of a soccer ball with pentagons and hexagons, for example. The positive Gaussian curvature allows the plane to form a sphere. However, if you replace all the pentagons with heptagons and put in seven hexagons for every five, you will get a plane that goes on infinitely (Wertheim, 20014). [See picture to the right] This plane is actually a hyperbolic plane because it curves away at every point but never connects back to another point. There have been multiple ways of modeling the hyperbolic plane to better understand hyperbolic geometry, especially by Vi Hart and Dr. Daina Taimina.
Vi Hart wanted a physical model of a hyperbolic plane to understand hyperbolic geometry better, so she used balloons to create hyperbolic plane models. Using a hyperbolic tiling where 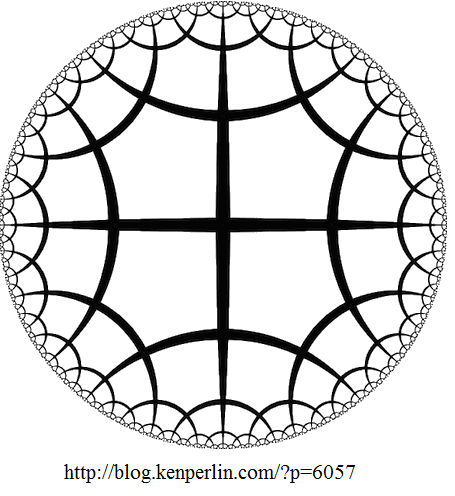 seven triangles meet at one point, she found that the model could be made with seven balloons. Then using a hyperbolic tiling with right angled pentagons [See picture to the left], she discovered if she had an infinitely long balloon the model could be made with that one balloon. However, balloons are not capable of this characteristic (Hart, 2011). These models are also hard to handle and see all the characteristics of hyperbolic planes.
Dr. Daina Taimina also experimented with different ways to model the hyperbolic plane. She found an easy to handle model of hyperbolic plane by crocheting [See picture to the right]. She wanted to make learning hyperbolic geometry enriching and comprehensible for her students, which is what inspired her to create a crocheted model. To make the model, one increases the number of stitches in each row in such a way that causes the stitches to increase exponentially. As more and more stitches are added on, more 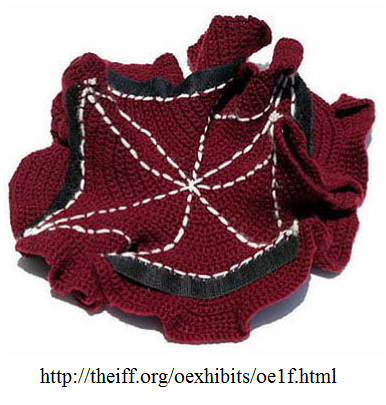 and more ruffles will form creating the hyperbolic plane (Wertheim, 2014). These crocheted models can be manipulated to easily show different aspects of hyperbolic geometry, which allows individuals to grasp the concept of hyperbolic geometry. These crocheted hyperbolic planes have been used to model coral reefs and to raise awareness to the depletion of coral reefs all over the country (TED, 2009).
Knowing and understanding hyperbolic geometry is important because it is found all over this world. For example, it is found in coral reefs, sound travel about 2,000 feet below the surface of the ocean, store bought lettuce leaves, kelp, and sea creatures (Wertheim, 2004; Mackenzie, 2002). The surface areas hyperbolic planes have are larger than on a flat plane, which is why creatures that follow the rules of hyperbolic geometry have larger surface areas. Having more surface area allows these sea creatures to survive because of the way it eats. With the filter-feeding organisms, having a large surface area allows the organism to eat more, which is why it has a hyperbolic plane (Wertheim, 2014). From this example, one can see how knowing and understanding hyperbolic geometry will provide us with more knowledge on the things that consist of hyperbolic geometry. Thus, the physical models created by Vi Hart and Dr. Daina Taimina that allow for more in-depth understanding of hyperbolic geometry will help us to better understand things that consist of hyperbolic geometry.
References:
Hart, V. (2011 November). Hyperbolic planes take off! Youtube. Podcast retrieved from https://www.youtube.com/watch?v=qsE2UKkIKXU.
K Perlin. (2011, 8 March). Hypergeography [Web blog]. Retrieved from: http://blog.kenperlin.com/?p=6057
Mackenzie, D. (2012). The geometry of whales and ants: Non-euclidean geometry. The Universe in Zero Words: The Story of Mathematics as Told Through Equations. Princeton University Press. Retrieved fromhttp://graphics8.nytimes.com/images/blogs/wordplay/Universe_in_Zero_Words_Copyright.pdf
Nightingale, K. (2011). Crochet coral and maths. Australian Geographic. Retrieved from http://www.australiangeographic.com.au/blogs/ag-blog/2011/01/crochet-coral-and-maths/.
TED. (2009 February). The beautiful math of coral. TED. Retreived from http://www.ted.com/talks/margaret_wertheim_crochets_the_coral_reef#t-145596.
The Institute for Figuring. (2014). Hyperbolic space share of the universe – Is our universe hyperbolic? Retrieved from: http://theiff.org/oexhibits/oe1f.html.
Wertheim, M. (2014). We are all corals now: A crafty yarn about global warming. The Brooklyn. Retrieved from http://www.brooklynrail.org/2014/04/criticspage/we-are-all-corals-now-a-crafty-yarn-about-global-warming.
Wertheim, M. (2004). Crocheting the hyperbolic plane: An interview with David Henderson and
Daina Taimina. Cabinet,16. Retrieved from http://www.cabinetmagazine.org/issues/16/crocheting.php.
~
The Algorithmic Stock Exchange Takeover
Guest Author: Isaac Trostle
The New York Stock Exchange and the Nasdaq. These are the two most well known stock exchanges that exist in the United States today. When we think of places like these, we imagine a room full of people in dress clothes yelling and screaming at the top of their lungs, buying and selling stocks. Outside of this crazed image, people think about sitting on their home computer stewing over different stocks. When they find one that they feel they want to purchase, they then send a message to their middleman trader who would then put in the order for the stock. Once this order was then put in, the buyer would then have their stock while the seller would have their money.
However, this is not the full picture. In a July 2011 TED Talk, Kevin Slavin introduced a new element that has entered the picture and has caught the attention of many upper echelon investors. In fact, many of these investors had no clue what this new element was and had not clue that it had been causing problems was for years. This new element is called electronic trading and is  controlled by high-frequency traders. These high-frequency traders are a bunch of computer wizzes who are creating algorithms to buy and sell stock. The key to these algorithms is that they don’t just buy and sell stock. Their goal is to predict the market for different stocks and buy them milliseconds before a human being can buy the stock from their own computer.
Now when you look at this situation on the surface, pennies are being lost. But when you look at the big picture, pennies in the stock market turn out to be hundreds and thousands of dollars. Steven Pearlstein, from the Washington Post, describes it perfectly when he says that, “when this kind of thing is done by human beings, it is called ‘front running’ and it is illegal. When it is done by high-speed computers programmed by Russian emigres, it’s celebrated as financial innovation.”
Since the Slavin TED Talk, Michael Lewis has come out with a book, Flash Boys, which goes into detail about these high-frequency traders. The book also goes into the story of how Brad Katsuyama, Ronan Ryan, and a few other men discover these traders, looked for solutions to the high-frequency trader problem, and eventually created their own stock market, IEX, to rid the current markets from the traders. This book seems like an interesting read and like it could give some light on the situation.
References:
http://www.ted.com/talks/kevin_slavin_how_algorithms_shape_our_world
http://www.washingtonpost.com/business/flash-boys-michael-lewis-does-it-again/2014/04/12/4a53daf8-bf5d-11e3-b195-dd0c1174052c_story.html
http://www.washingtonpost.com/rf/image_296w/2010-2019/WashingtonPost/2014/04/11/Production/Sunday/SunBiz/Images/pearsteinjump0413.jpg
http://www.nytimes.com/2014/04/06/magazine/flash-boys-michael-lewis.html?_r=1
http://thedailyshow.cc.com/full-episodes/jfbgkv/april-1–2014—michael-lewis
~
Are Cities and Corporations Structured by Math?
Guest Author: Tyler Busch

Credit: http://cdn.theatlanticcities.com/img/upload/2012/04/06/crop3/large.jpg
In a 2011 TED Talk Geoffrey West highlights new studies of cities and corporations that have found the existence of a mathematical relationship between cities and their infrastructure (find talk here). This can help city planners to better understand the necessities of their cities and what they need to best serve their citizens. With the realization of the relationships cities can be more efficient in their construction and humans can more cohesively live in large concentrations. This successful concentration of people has then positive implications of creativity and production.
Social scientists and mathematicians have been working to understand the relationships with how cities grow and then the relationship with the necessary infrastructure of the city, such as water pipes, sewer lines, and electricity. The relationship has been found to be sub-linear. Sub-linear is particularly important since this allows for the population to increase while the infrastructure increases at a slower pace. This is extremely important because it shows that cities are more efficient as they increase in size. Resources become more concentrated and less is needed to supply more.
There exist even more positives to large cities according to the researchers. The high concentration of people has been shown to increase the output of new creative ideas. This is believed to be true since there is more capital and more resources in a larger city to allow for more free thought and experimentation. It cannot be assumed that creating new great ideas in small cities will either make the city boom and become a great city or that small cities will not develop creative ideas. Smaller cities that boom from a new technology or new industry are likely to fade as soon as there are issues with this one boom. This does not exist in larger cities since there tends to be multiple sources to provide for economic stability.
The world is a dynamic environment that is always changing. To improve society we need to know how cities affect efficiency and output. Further research is needed to learn more about these relationships. The use of mathematics can help broaden our understanding of what makes cities successful. Scalability of cities needs further mathematical exploration in order to draw out all of the potential benefits and negatives of large cities. Benefits can be endless, but we also must remember that there are limits and there might be hidden negatives of large cities. Mathematical modeling can help us understand where these limits exist and prescribe fixes for the cities where needed.
Sources:
Ehrenberg, R. (2013). Story one: Math targets cities’ essence: New formula relates city size to infrastructure, productivity. Science News, 184(1), 5-6. doi:10.1002/scin.5591840103
Lobo, J., Bettencourt, L. A., Strumsky, D., & West, G. B. (2013). Urban Scaling and the Production Function for Cities. Plos ONE, 8(3), 1-10. doi:10.1371/journal.pone.0058407
Van Noorden, R. (2010). Cities: Building the best cities for science. Nature, 467(7318), 906-908. doi:10.1038/467906a
Geoffrey West TED Talk, July 2011. http://www.ted.com/talks/geoffrey_west_the_surprising_math_of_cities_and_corporations
~
Modeling London Rioters and Human Behavior
Guest Author: Jay Graffagna
Human behavior may seem too complex to determine the results of human decisions and actions because the influences and factors determine the outcome or decision. This is not exactly the case, as Hannah Fry states in her TED talk. Human behavior can be modeled and put into equations to help predict the outcomes. The modeling solution may not predict the exact outcome of the behavior, but can provide a range in which the result may fall under and be able describe the trend. As a result of the modeling, a sociologist or department examining human behavior, such as a police department, can get a generalization of where or how a human action may lead or result.
It is important for people within the math community to understand the importance of collaboration between different studies and our own. Mathematical models can provide these studies with complex analysis of the provided data or constraint, which can help in trying to determine human behavior. As Hannah Fry studied the human behavior of London rioters. she worked with the police to try and identify and keep riots under control based on results of her modeling. She broke the problem down into three parts. The first being decision to riot and the influence on the person to riot or influence on another to riot. The second is determining their riot site, which is done by proximity of the riot to an individual. The graph below describes the distance and correlation of distance from home for a chosen riot site. The third is the interaction with police or not being caught. Hannah compares the model to predator prey modeling. From the resulting models, the police could use to determine the most likely location and how large the riot could be so better preparation for the police. She uses dynamical systems to model the relationships between different factors of the rights. This is a system of equation representation with constants constructed from data on the riots. It also uses continuous and discrete change patterns in the modeling.

An important thread to always follow within a mathematical model is to back your work with real data or build your model from real data. When reading through Mazur’s article, he claims at the end the five important conclusions to take from modeling behavior. From the conclusion described, it is easy to build a model to try and predict behavior, but in order to optimize model the individual must support the reasoning for each aspect of the model and determine each aspect with data or assumptions made before an experiment is conducted.
What human behavior can you model? This question is spanned based on Hannah Fry’s examination of human behavior modeling. In other studies, researchers have looked into other human behavior to produce a model to help determine the decision of the individual or group. It is important for an individual creating a study of human behavior modeling to consider the different aspects of the process to make a predicting model. The individual needs to create assumptions and steps in which the behavior will follow of the individual. Next to take resulting data from an experiment to determine the accuracy of the model. Identify mistakes from the data examination to better the model. Reflection on the project or study is important to being successful because it can allow you to view the work from a larger respective and to identify weaknesses. In this case, any behavior can be model, but the individual trying to construct the model must have a purpose for the model and a clear goal in what is trying to be determined.

Sources:
“Is Life Really That Complex? Hannah Fry at TEDxUCL.” YouTube. YouTube, 02 July 2012. Web. 04 May 2014.
Li-Peng, Song, et al. “Adaptive Human Behavior In A Two-Worm Interaction Model.” Discrete Dynamics In Nature & Society (2012): 1-13. Academic Search Premier. Web. 27 Mar. 2014.
Mazur, James E. “Mathematical Models and the Experimental Analysis of Behavior.”J Exp Anal Behav. Mar 2006;85(2): 275–291.
Nature.com. Nature Publishing Group, n.d. Web. 04 May 2014.
“Psychology of Human Behavior.” Psychology of Human Behavior. N.p., n.d. Web. 04 May 2014.
~
Finding Large Primes
Guest Author: Jim Trainor

Source: Ted.com
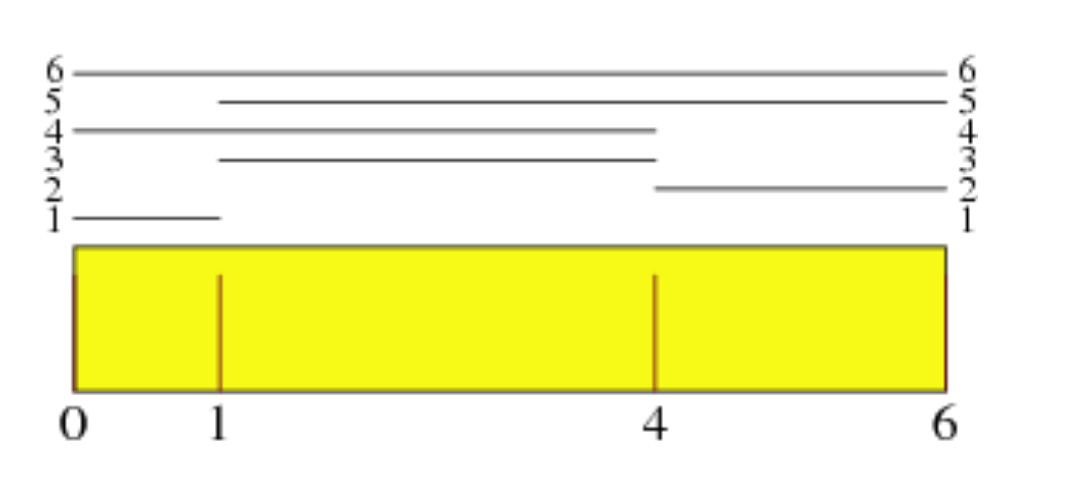
The largest currently known prime number is 257,885,161 − 1. It has 17,425,170 digits, and was found to be prime in January of 2013 by Dr. Curtis Cooper of the University of Central Missouri. In his talk “Why I Fell in Love with Monster Prime Numbers,” Adam Spencer talks about the history of finding large primes, including this newest one. And watching this talk made me wonder how exactly a mathematician does go about finding large primes. As it turns out, it’s actually pretty interesting.
So, let’s say you have some number, say, 153. And you want to know whether or not it’s prime. Well, the first thing to do would be to check what it is in mod 6. All integers can be written as either 6x, 6x+1, 6x+2, 6x+3, 6x+5, or 6x+5, for some integer x. Now, obviously an integer that can be written as 6x isn’t prime, since it’s plainly a multiple of 6. And since 6x+2, 6x+3, and 6x+4 can be rewritten as 2(3x+1), 3(2x+1), and 2(3x+2), respectively, none of these can possibly be prime. So this just leaves us with 6x+1 and 6x+5; that is, any number that is congruent to 1 or 5 mod 6.
So, let’s go back to our example, 153. 150 divides evenly by 6, so 153 mod 6 is equal to 3. Therefore, 153 cannot be prime. Then we need a new candidate. 154 and 156 are even, so they’re no good. And 155 is a multiple of 5, so it’s out too. But what what 157? It’s equal to 1 mod 6, so it’s potentially a prime. So where do we go from here?
The next step would be to check its factors. Now, checking that none of the 156 positive integers less than 157 seems like it’d take a lot of time, so let’s just look at the primes less that 157, since any composite factors 157 could just be reduced down to prime factors anyway. That leaves us with 36 potential factors, but that can still be reduced further. To show how that works, let’s look at the factors of 100. You’ve got 1×100, 2×50, 4×25, 5×20, 10×10, 20×5, 25×4, 50×2, and 100×1. You’ll notice that, after you pass the square root of 100, 10, the new factors are really just repeats of the older ones. So it works out that for any number, you won’t find any new pairs of factors once you go past the square root of that number. So, going back to 157. The square root of 157 is somewhere between 12 and 13, so the only potential factors we need to check are 2, 3, 5, 7, and 11. And, as it turns out, 157 is not a multiple of any of these, and so must be prime.
That would be, at least in my opinion, the easiest way to check if any given number was prime. However, most groups searching for new primes don’t search like this. Groups such as the Great Internet Mersenne Prime Search, or GIMPS, use the Lucas-Lehmer primality test to check for Mersenne primes. A Mersenne prime is a prime that can be written in the form 2p-1, where p is some prime number, and is generally abbreviated to Mp, where p is that same prime. You’ll notice that the currently that the current largest prime is a Mersenne prime, for example. And what the Lucas-Lehmer primality test does is that it makes a sequence starting with 4, and with each successive number equalling the last number squared, minus 2. So the sequence begins, s0 = 4,
s1 = 42-2 = 14, s2 = 142-2 = 194, etc. And it has been proven that, for a Mersenne number Mp, Mp is prime if and only if sp-2 is congruent to 0 mod Mp. [2] So, instead of checking every potential prime, GIMPS and groups like it apply this test to increasingly large Mersenne numbers, and this will give them, with any luck, new Mersenne primes.
Now this leaves the question of how this computing is done. These are incredibly large numbers being processed, and it would take a lot of computing power to find new Mersenne numbers, let alone finding sp-2 to test it against. And this is where GIMPS and other groups found a clever solution. Instead of buying up many, many computers to get enough resources, they open-sourced the project. They provide software to download free of charge, which anyone around the world can install onto their computer. Then, while the software is running on your computer, it either tests potential Mersenne primes, or double-checks older tests to make sure their were no mistakes. Once it finishes a test, the software sends the results back to GIMPS, and begins work on a new assignment. And since this software runs on the lowest priority, it won’t make your computer run any worse than normal, as anything you try to do takes precedence over the GIMPS software. [3]
Since it was founded in 1997, GIMPS and contributors to it like Curtis Cooper have found 14 of the 48 known Mersenne primes. [4] There are other, similar projects, like Wieferich@Home, which tests for Wieferich primes, and the Twin Prime Search, which, as the name implies, searches for twin primes. And what all three of these have in common is the use of distributed computing. Instead of keeping all the research in some huge, walled-off supercomputer, they allow people from all over the world to contribute to finding these numbers. And even if it’s difficult, if not nearly impossible for a person to do the math themself to test these numbers, they still have the ability to contribute to testing them, and potentially helping to find the next largest prime, and become a small piece of math history.
Sources:
1) Spencer, Adam.”Why I fell in love with monster prime numbers.” TED. TED Conferences, LLC, 1 Feb. 2013. Web. 22 May 2014. <http://www.ted.com/talks/adam_spencer_why_i_fell_in_love_with_monster_prime_numbers>.
2) Weisstein, Eric W. “Lucas-Lehmer Test.” From MathWorld–A Wolfram Web Resource. Web. 22 May 2014. <http://mathworld.wolfram.com/Lucas-LehmerTest.html>
3) “GIMPS How it Works.” Mersenne Research, Inc. 30 Nov. 2008. Web. 22 May 2014. <http://www.mersenne.org/various/works.php>
4) “48th Known Mersenne Prime Discovered.” Mersenne Research, Inc. Web. 22 May 2014. <http://www.mersenne.org/various/57885161.htm>