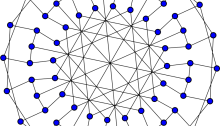
Balaban 10-Cage
This is the Balaban 10-cage, the first known (3,10)-cage. An (r,g)-cage is graph where every vertex has r neighbors, the shortest cycle has length at least g, and the number of vertices is maximal given these constraints.
![]()
This is the Balaban 10-cage, the first known (3,10)-cage. An (r,g)-cage is graph where every vertex has r neighbors, the shortest cycle has length at least g, and the number of vertices is maximal given these constraints.
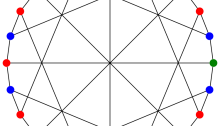
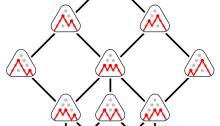
This is the McGee graph. It is 3-regular graph, meaning that every vertex has 3 neighbors. It also has girth 7, meaning that the shortest cycles have length 7. What makes the McGee graph special is that it has the least number of vertices of any 3-regular graph of girth 7.
This picture by Greg Egan shows a hypercube with all vertices except the bottom labelled by duads, that is, 2-element subsets of a 6-element set. There are 15 duads, while the hypercube has 16 vertices.
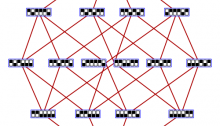
This picture shows the Tutte–Coxeter graph. This graph was discovered by the famous graph theorist William Thomas Tutte in 1947, but its remarkable properties were studied further by him and the geometer H. S. M. Coxeter in a pair of papers published in 1958.

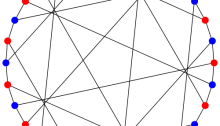
This is the Heawood graph. This graph can be drawn on a torus with no edges crossing in such a way that it divides the torus into 7 hexagons, each pair of which shares an edge. In 1890, Percy John Heawood proved that for any map drawn on a torus, it takes at most 7 colors to ensure that no two countries sharing a common boundary have the same color. The Heawood graph proves that the number 7 is optimal.
This picture by Tilman Piesk shows the 14 Dyck words of length 8. A Dyck word is a balanced string of left and parentheses. In the picture, a left parenthesis is shown as upward-slanting line segment, and a right parenthesis as a downward-slanting one.
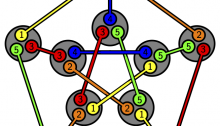
Suppose you have a set with 5 elements. There are 10 ways to choose a 2-element subset. Form a graph with these 10 choices as vertices, and with two vertices connected by an edge precisely when the corresponding subsets are disjoint. You get the graph shown here, called the Petersen graph.
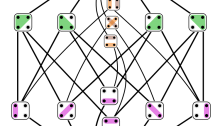
This picture by Tilman Piesk shows the 15 partitions of a 4-element set, ordered by refinement. Finer partitions are connected to coarser ones by lines going down. In the finest partition, on top, each of the 4 elements is in its own subset. In the coarsest one, on bottom, all 4 elements are in the same subset.
The Kepler problem concerns a particle moving under the influence of gravity, like a planet moving around the Sun. Newton showed the orbit of such a particle is an ellipse, assuming it doesn’t fly off to infinity. There are many ways to prove this, but the most illuminating is to reparametrize time and think of the orbit as a circle in 4 dimensions. When the circle is projected down to 3-dimensional space, it becomes an ellipse. The animation in this post, created by Greg Egan, shows how this works.
This image by Greg Egan shows 5 ways to inscribe a regular tetrahedron in a regular dodecahedron. The union of all these is a nonconvex polyhedron called the compound of 5 tetrahedra, first described by Edmund Hess in 1876.
Notices of the AMS · Bulletin of the AMS
American Mathematical Society · 201 Charles Street Providence, Rhode Island 02904-2213 · 401-455-4000 or 800-321-4267
© Copyright 2025, American Mathematical Society · Privacy Statement