Petersen Graph – Japheth Wood
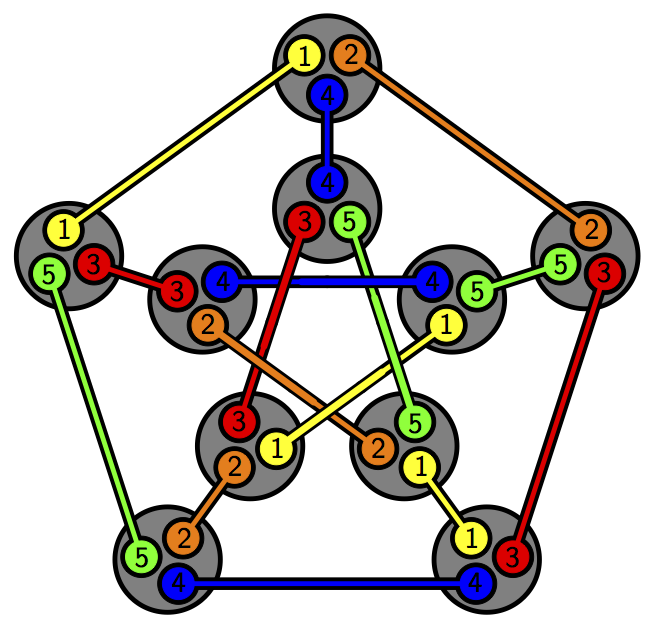
Suppose you have a set with 5 elements. There are 10 ways to choose a 2-element subset. Form a graph with these 10 choices as vertices, and with two vertices connected by an edge precisely when the corresponding subsets are disjoint. You get the graph shown here, called the Petersen graph.
The picture above, made by Japheth Wood, also appears here:
• Japheth Wood, Proof without words: the automorphism group of the Petersen graph is isomorphic to \(\mathrm{S}_5\), Mathematics Magazine 89 (October 2016), 267.
As the title indicates, it’s easy to use this picture to determine the symmetry group of the Petersen graph.
The Petersen graph is reputed to be a counterexample to many conjectures about graph theory, and it shows up in many places. We have described it as an example of a ‘Kneser graph’. The Kneser graph \(KG_{n,k}\) is the graph whose vertices correspond to the \(k\)-element subsets of an \(n\)-element set, where two vertices are connected by an edge if and only if the two corresponding subsets are disjoint.
We can also get the Petersen graph by taking a regular dodecahedron and identifying antipodal vertices and edges.
Or, take the complete graph on 5 vertices, \(K_5\), and form a new graph with the edges of \(K_5\) as vertices, with two of these vertices connected by an edge if the corresponding edges in \(K_5\) do not share a vertex. The result is the Petersen graph! We say the Petersen graph is the complement of the line graph of \(K_5\).
For more details, see:
• Wikipedia, Petersen graph.
The Petersen graph also shows up when you consider all possible phylogenetic trees that could explain how some set of species arose from a common ancestor. These are binary trees with a fixed number of leaves where each edge is labelled by a time in $[0,\infty)$. The space of all such trees is contractible, but nonetheless topologically interesting. The space of phylogenetic trees with 4 leaves is the cartesian product of the cone on the Petersen graph and $[0,\infty)^5$. For pictures illustrating this, see:
• Louis Billera, Susan Holmes and Karen Vogtmann, Geometry of the space of phylogenetic trees, Advances in Applied Mathematics 27 (2001), 733-767.
For related ideas, see
• John Baez, Operads and the tree of life.
Here is another picture illustrating the relation between the Petersen graph and 2-element subsets of a 5-element set:
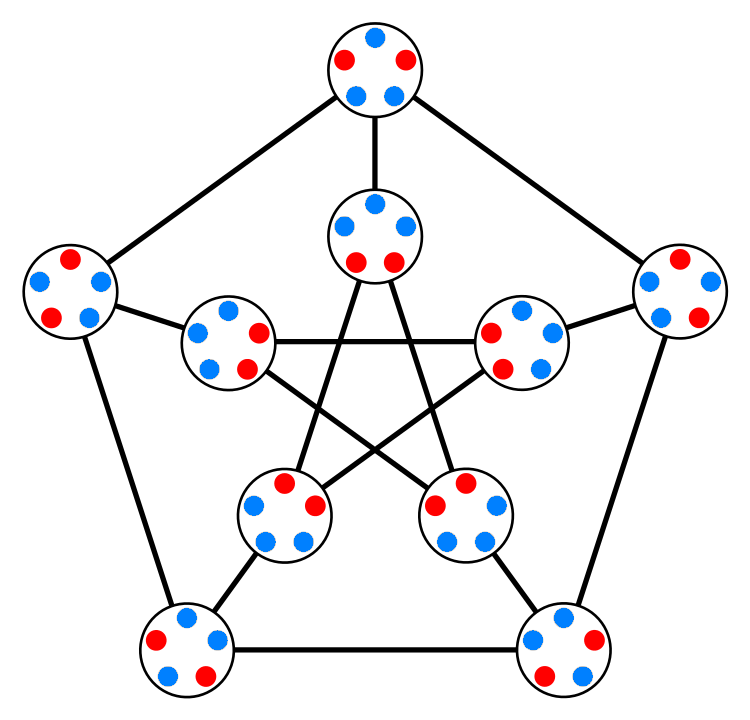
Petersen Graph – Tilman Piesk
The picture here is adapted from one that Tilman Piesk created and put into the public domain on Wikicommons.
Visual Insight is a place to share striking images that help explain advanced topics in mathematics. I’m always looking for truly beautiful images, so if you know about one, please drop a comment here and let me know!


The first picture also demonstrated the Petersen colouring, also known as normal 5-colouring.
(Every edge in a normally colored graph is normal, i.e. it uses together with its four neighbours either only three colors or all five colors.)