
While many businesses have seen significant downturns during the pandemic, several scholarly publishers have reported increases in submissions in the first part of 2020. There are various studies and articles about the phenomenon. Meanwhile, at Mathematical Reviews, we have not noticed any significant increase in the number of publications in mathematics during 2020. Note that we count publications and the announcements and studies just mentioned are counting submissions. In what follows, I look at some data about publications in mathematics in 2020, with comparisons to 2019. the data come from four sources: Dimensions, Web of Science, the Mathematical Reviews Database, and the arXiv.
A Scholarly Kitchen post by Christos Petrou links to announcements about exceptional growth in submissions from three publishers: SpringerNature reporting an 11% increase in submissions in the first six months, Elsevier reporting 25% growth for submissions to their subscription journals from January to September, and Wiley reporting a 13% increase for their fiscal year 2020, which ended April 30, 2020. The large study by Squazzoni, Bravo, Grimaldo, Garcia-Costa, Farjam, and Mehmani looked at hundreds of thousands of submissions to Elsevier journals between February and May in the three years 2018, 2019, and 2020. They found that the number of submissions to all Elsevier journals in February-May 2020 increased 58% over the number of submission in the comparable four-month period in 2019. For health and medicine journals, the increase was 92%. Their paper does not address submission rates in mathematics. There are also reports that men’s productivity has increased more than women’s productivity during the pandemic. The study by Squazzoni, et al., looked at this in detail – indeed it is their focus, finding a statistically significant negative effect on women’s submission rates in three of the four large research areas they studied. Curiously, in some categories in the Squazzoni, et al. study, submissions by women went up, but those increases were far outpaced by the increases in submissions by men. One hypothesis mentioned in the studies is that with many scientists unable to work in their laboratories, they are finding time to write papers. This seems plausible, and would also explain why the phenomenon is not showing up in the mathematics literature.
Growth in publications in all subjects
The Scholarly Kitchen post by Christos Petrou mentioned above analyzed publication rates using data available via the free version of Dimensions, which is a tool for discovering and analyzing research developed by and available from Digital Science. He restricted his analysis to looking only at publications from the ERA 2018 journal list, which is a curated list from the Australian Research Council. Petrou considered further restrictions to publications from ERA 2018 journals that are also in the Directory of Open Access Journals (DOAJ) and to ERA 2018 journals not in the DOAJ. He also restricted to ERA 2018 journals in the Nature Index. (It seems that the Nature Index journals are a proper subset of the ERA 2018 list.) The data I collected from Dimensions for Nature Index journals were very different from what Petrou reported. I don’t know why. In any case, I am omitting any analysis for Nature Index journals.
At the time of Petrou’s blog post (November 19, 2020), the year 2020 hadn’t finished yet, so he made forecasts about how the year would finish. His data from Dimensions appear to have been from October 29, 2020, based on his descriptions of his low and high estimates. Petrou concluded that there has been an unusual growth in publications in the sciences in 2020 and that there has not been a similar growth in the arts and humanities. He based this on comparisons of the Compound Annual Growth Rate (CAGR) for the years 2013 to 2019 with the estimated growth rate for 2020. The formula for the CAGR for this period is $(1/6)\ln(N_{2019}/N_{2013})$ where $N_{2019}$ is the count of publications in 2019 and $N_{2013}$ is the count of publications in 2013. In just about every category, the estimates are well above the CAGR.
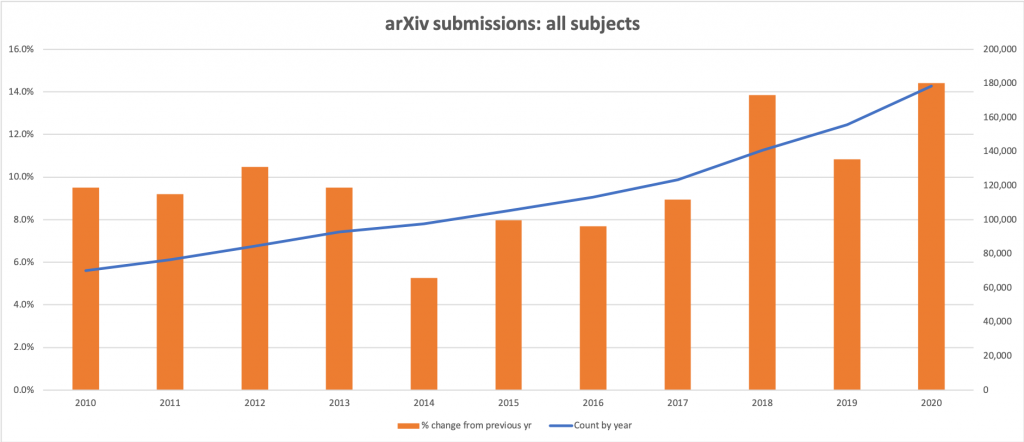
Now that the year is done, it is possible to use complete data, rather than estimates. Petrou’s estimates were generally high, which might reflect increased activity at the start of the year, followed by a slowing in the last couple of months. Repeating his analysis with data from the full year, one can still come to similar conclusions in most cases: even though the actual growth rates for 2020 were generally lower than the estimates, they were greater than the CAGR.
| . . . . . . . . . .% change in 2020. . . . . . . . . . | ||||
| All Subjects | CAGR | Low est. | High est. | Actual |
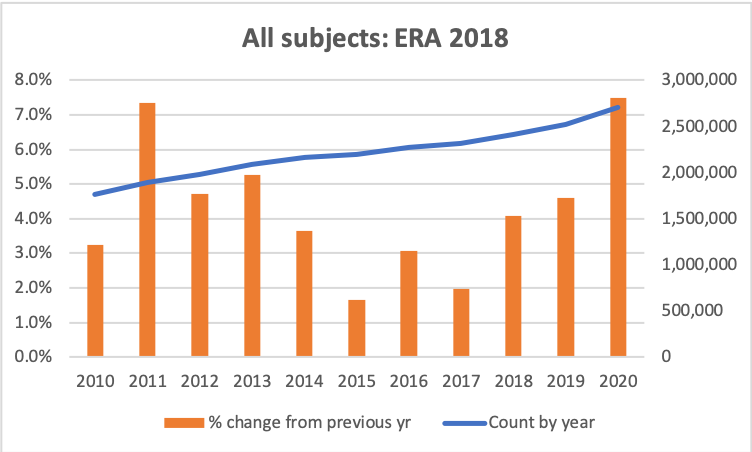
| ERA 2018 | 3.1% | 17% | 26% | 7.5% |
| ERA 2018 and DOAJ |
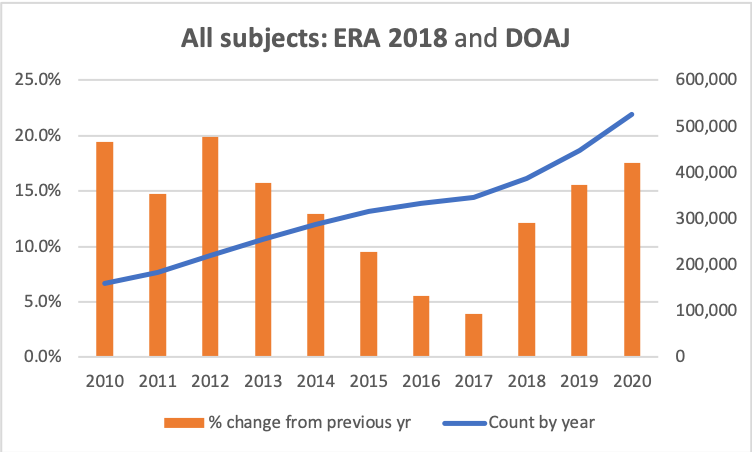
9.4% | 16% | 26% | 17.5% |
| ERA 2018 not DOAJ |
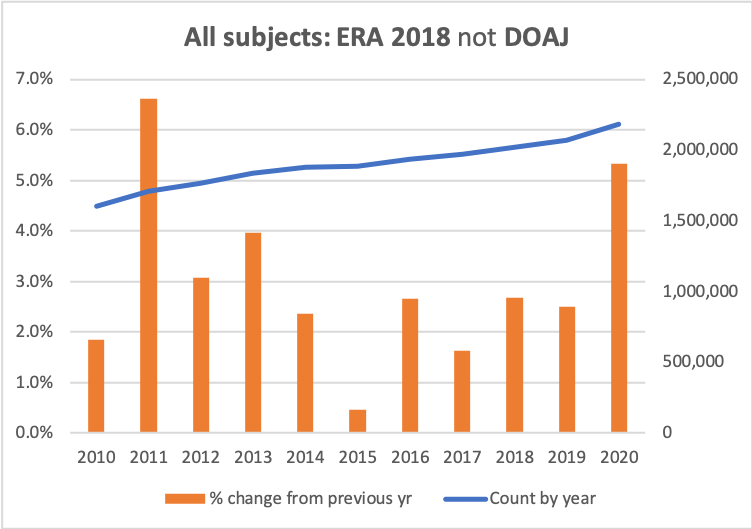
2.0% | 17% | 26% | 5.3% |
Looking at the growth rates for the last three years indicates that the growth rates for 2020 are certainly up, but they are not quite as anomalous as the comparison with the CAGR would indicate. The growth rates for all of the last three years are above the CAGR. The high growth for 2020 looks like it is part of a trend, rather than a deviation.
| All Subjects | CAGR | % change in 2018 | % change in 2019 | % change in 2020 |
| ERA 2018 | 3.1% | 4.1% | 4.6% | 7.5% |
| ERA 2018 and DOAJ | 9.4% | 12.2% | 15.6% | 17.5% |
| ERA 2018 not DOAJ | 2.0% | 2.7% | 2.5% | 5.3% |
Graphing the counts and the growth rates for several years shows that two of the rates have been increasing for the last three years. The third category, ERA 2018 not DOAJ was up dramatically for 2020, but that rate has seen a lot of fluctuation since 2010.
Comment
I find it curious that Christos Petrou’s predictions for 2020 were so far above the actuals. His method seems reasonable. It is possible that there was a surge in the early part of the year, that died off. Looking at the monthly data for submissions to the arXiv and comparing the same months in 2018, 2019, and 2020, mathematics (excluding cross-listings) had a large year-to-year increase (36.6%) for June 2020. Physics had a large increase spread out over June and July 2020 (18.1% and 14.7%). Other months had much smaller year-to-year increases, or even decreases. Now, arXiv data represent submissions rather than publications, but they provide a hint.
It was pointed out by Gabor Schubert in the comments to Petrou’s post that you can query Crossref for publications by month using their API. Crossref is an official DOI Registration Agency of the International DOI Foundation and has metadata about almost every online publication. The publication date is provided to Crossref by the publisher. The analysis by Petrou was intentionally focused on a strict subset of the scholarly literature. The Crossref data, being from every publisher registered with Crossref, is from a much larger set.
Looking at the Crossref data for journal articles for January 1 to October 31 gives:
| Jan to Oct | Count | % Change |
| 2016 | 2,389,254 | |
| 2017 | 2,529,461 | 5.9% |
| 2018 | 2,719,713 | 7.5% |
| 2019 | 2,932,805 | 7.8% |
| 2020 | 3,189,889 | 8.8% |
Here are the Crossref counts for the full years:
| Jan to Dec | Count | % Change |
| 2016 | 3,425,201 | |
| 2017 | 3,607,850 | 5.3% |
| 2018 | 3,870,301 | 7.3% |
| 2019 | 4,181,142 | 8.0% |
| 2020 | 4,449,468 | 6.4% |
Indeed, the growth for the whole year was much lower than what the first ten months would have predicted.
Looking more closely at the Crossref data, one sees that monthly publication rates increase from January to December each year. Indeed, the publication rate for the second half of any of the five years 2016 to 2020 is 37% to 39% higher than the publication rate for the corresponding first half of the year. Publication rates in the last two months of the year tend to be about 1.8 times as high as average monthly publication rates in the same year. The year 2020 was an exception in that the November and December publication rates were only 1.7 times as high as the average monthly publication rates for 2020. In other words, it appears that Christos Petrou’s predictions for 2020 may have been thrown off by a smaller increase in November and December than usual.
Growth in publications in mathematics
Dimensions data
Let’s begin by looking at a subset of the data set used by Petrou. Using the Dimensions data for publications just in mathematics (Field of Research = 01 Mathematical Sciences) gives noticeably different trends from the data for all subjects.
| Mathematics | CAGR | % change in 2018 | % change in 2019 | % change in 2020 |
| ERA 2018 | 2.3% | 6.2% | 7.1% | 8.0% |
| ERA 2018 and DOAJ | 5.6% | 25.8% | 24.7% | 36.8% |
| ERA 2018 not DOAJ | 1.9% | 3.9% | 4.7% | 3.3% |
Again, it is instructive to look at graphs of the counts and growth rates since 2010. In each category, the growth rate for 2020 beats the CAGR, but looking at the trends in the growth rates, these do not look exceptional.
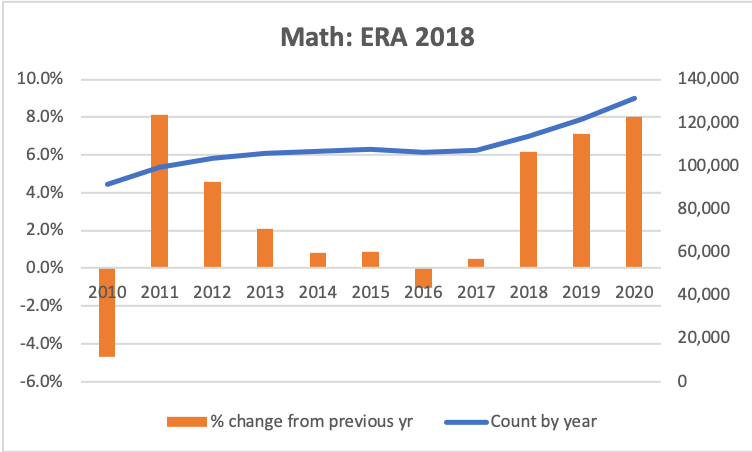
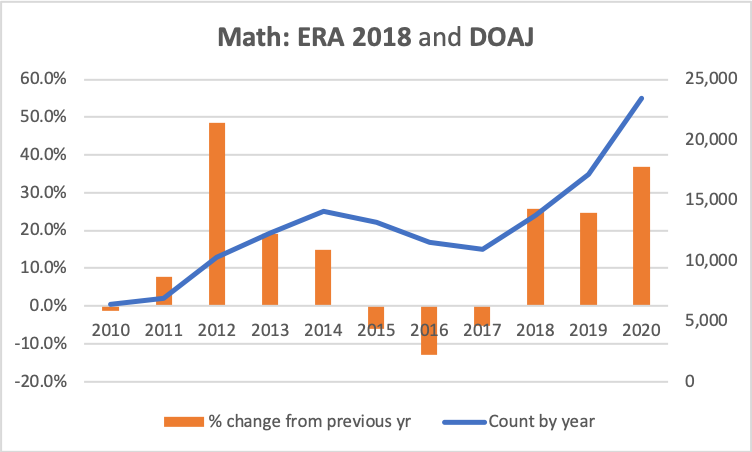
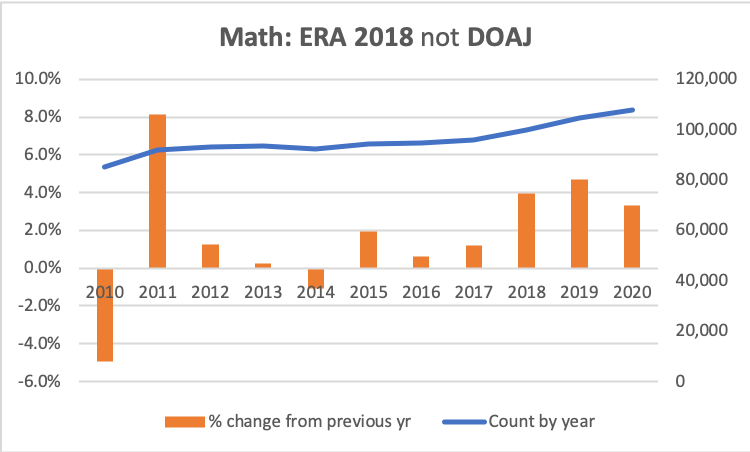
Once again, the growth rates in the various categories for 2020 are above the CAGR, but so are the growth rates for 2018 and 2019.
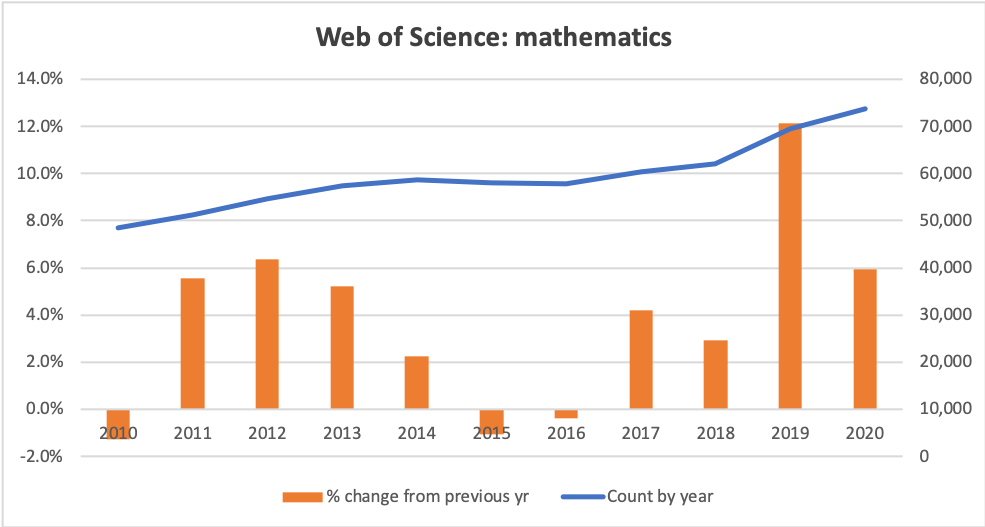
Web of Science data
I searched Web of Science to look for trends. I restricted the search to their Science Citation Index Expanded (SCI-EXPANDED) collection, with document type = Article, and subject area = mathematics. The results are in the following table:
| Year | Count | Growth rate |
| 2010 | 48,596 | -1.3% |
| 2011 | 51,300 | 5.6% |
| 2012 | 54,570 | 6.4% |
| 2013 | 57,428 | 5.2% |
| 2014 | 58,720 | 2.2% |
| 2015 | 58,089 | -1.1% |
| 2016 | 57,876 | -0.4% |
| 2017 | 60,306 | 4.2% |
| 2018 | 62,063 | 2.9% |
| 2019 | 69,585 | 12.1% |
| 2020 | 73,715 | 5.9% |
The CAGR is 3.2%. The growth for 2020 is not particularly remarkable within the time frame. The exceptional year was 2019 with a 12.1% increase over 2018, but that growth rate was not sustained in 2020, dropping by half. The graph of the counts and growth rates is below:
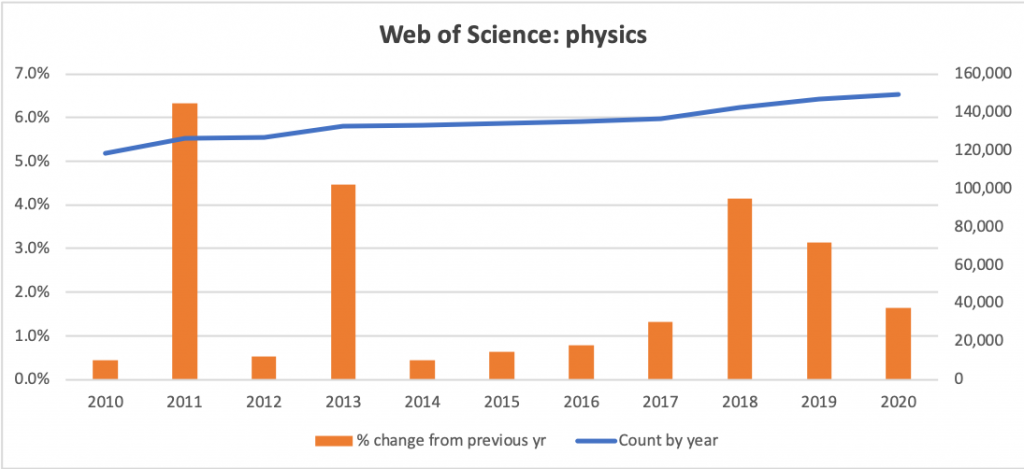
For comparison, here are the data for physics in Web of Science.
| Year | Count | Growth rate |
| 2010 | 118,671 | 0.4% |
| 2011 | 126,177 | 6.3% |
| 2012 | 126,845 | 0.5% |
| 2013 | 132,505 | 4.5% |
| 2014 | 133,093 | 0.4% |
| 2015 | 133,948 | 0.6% |
| 2016 | 134,985 | 0.8% |
| 2017 | 136,760 | 1.3% |
| 2018 | 142,437 | 4.2% |
| 2019 | 146,906 | 3.1% |
| 2020 | 149,329 | 1.6% |
Mathematical Reviews data
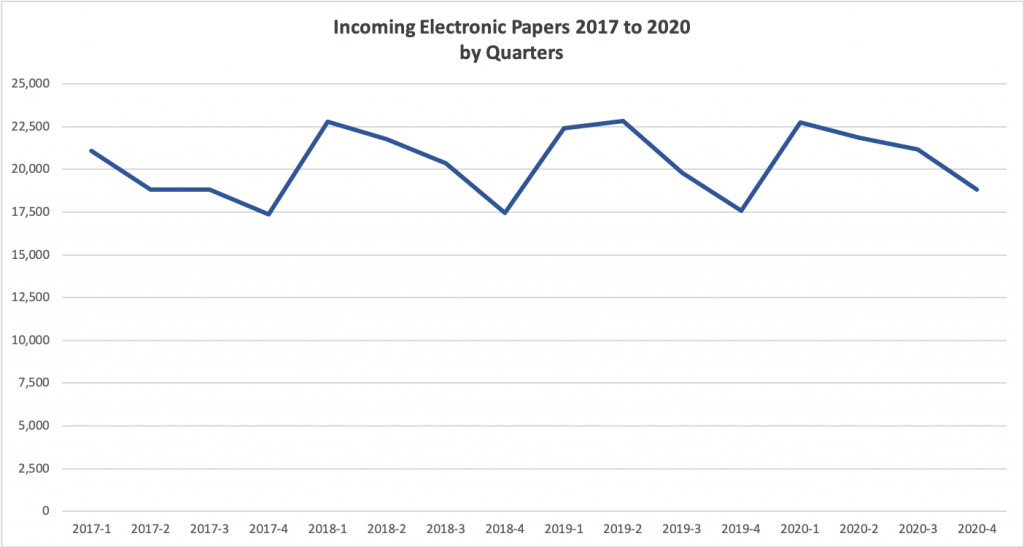
At Mathematical Reviews, we receive journal articles, conference proceedings, and books in various ways. Some are delivered to us electronically by the publishers. Some we retrieve electronically. Some are still delivered in paper. I want to focus on the counts of journal articles being delivered to Mathematical Reviews by the publishers. Our operations were interrupted by the pandemic. Therefore, including the counts of papers we retrieved would introduce confounding variables, which I prefer to avoid. I only have consistent data for these counts starting in 2017. Below is a graph of the counts by quarter from 2017 to 2020. It is evident from the graph that there were no extraordinary increases in 2020.
The growth rates by year are
| Year | % change from previous yr |
| 2018 | 8.3% |
| 2019 | 0.3% |
| 2020 | 2.4% |
arXiv data: Mathematics
Finally, let’s look at some data from the arXiv. The arXiv is quite generous about making their data available. In some cases, you can download a CSV file with data, or you can read it off tables. There were some types of data, though, where I had to do repeated searches to obtain what I was after. Even so, it is a fairly easy process. One benefit of these data are that we can count submissions.
Looking at all subjects in the arXiv over time, the growth in submissions is clearly consistent and exponential. There are confounding factors, though. For instance, over the years, the subjects covered by the arXiv have expanded. Even so, looking at the data since 2010, it does not seem that 2020 was extraordinary. Indeed, last year’s growth rate was roughly the same as the growth rate in 2018.
| Year | Count | Rate |
| 2010 | 70,131 | 9.5% |
| 2011 | 76,578 | 9.2% |
| 2012 | 84,603 | 10.5% |
| 2013 | 92,641 | 9.5% |
| 2014 | 97,517 | 5.3% |
| 2015 | 105,280 | 8.0% |
| 2016 | 113,380 | 7.7% |
| 2017 | 123,523 | 8.9% |
| 2018 | 140,616 | 13.8% |
| 2019 | 155,866 | 10.8% |
| 2020 | 178,329 | 14.4% |
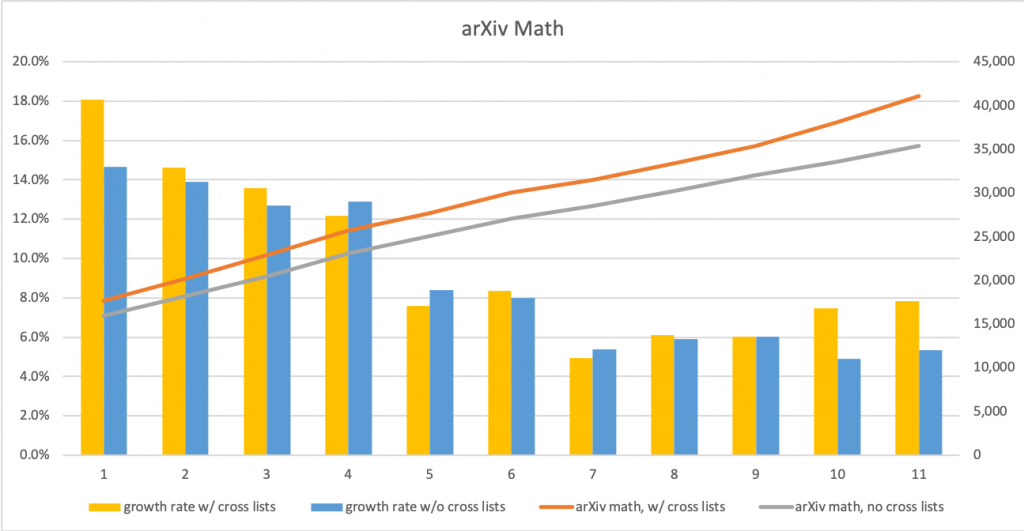
Looking at counts of submissions in mathematics was more tedious. The arXiv provides visual information here, but they do not provide a CSV file of the data. Therefore, I used the arXiv’s advanced search feature, searching a year at a time. It is possible to count papers in two ways: preprints that are only listed under mathematics and preprints that are in mathematics, but also cross-listed in another subject. The data for both searches, as well as the annual growth rates, are in the following table.
| arXiv math | ||||
| Year | counts, with cross lists | growth rate, with cross lists | counts, no cross lists | growth rate, no cross lists |
| 2009 | 14,928 | 13,919 | ||
| 2010 | 17,626 | 18.1% | 15,958 | 14.6% |
| 2011 | 20,202 | 14.6% | 18,174 | 13.9% |
| 2012 | 22,946 | 13.6% | 20,483 | 12.7% |
| 2013 | 25,742 | 12.2% | 23,123 | 12.9% |
| 2014 | 27,693 | 7.6% | 25,059 | 8.4% |
| 2015 | 30,002 | 8.3% | 27,057 | 8.0% |
| 2016 | 31,488 | 5.0% | 28,512 | 5.4% |
| 2017 | 33,407 | 6.1% | 30,196 | 5.9% |
| 2018 | 35,416 | 6.0% | 32,019 | 6.0% |
| 2019 | 38,055 | 7.5% | 33,581 | 4.9% |
| 2020 | 41,027 | 7.8% | 35,371 | 5.3% |
| CAGR | 6.5% | 6.2% | ||
Looking at the data, the counts and the growth rates for 2020 do not stand out. Indeed, the CAGR for 2020 with cross listings is 6.5%, a bit below the observed rate for 2020. The CAGR for 2020 without cross listings is 6.2%, which is actually higher than the observed rate for 2020.
Here is a graphical representation of the same data:
arXiv data: Physics
For comparison, I looked at similar data for physics in the arXiv. The growth rates for physics submissions to the arXiv, both with and without cross listings, were higher than recent years, and greater than the CAGRs for the two categories. The growth rate for physics in the arXiv has a lot of variation, though, making it hard to conclude if 2020 was an exceptional year or just a very good year.
| arXiv physics | ||||
| Year | counts, with cross lists | growth rate, with cross lists | counts, no cross lists | growth rate, no cross lists |
| 2009 | 45,567 | 44,253 | ||
| 2010 | 47,831 | 5.0% | 45,989 | 3.9% |
| 2011 | 51,115 | 6.9% | 48,959 | 6.5% |
| 2012 | 53,378 | 4.4% | 50,825 | 3.8% |
| 2013 | 55,844 | 4.6% | 53,349 | 5.0% |
| 2014 | 56,944 | 2.0% | 54,412 | 2.0% |
| 2015 | 59,742 | 4.9% | 57,076 | 4.9% |
| 2016 | 61,598 | 3.1% | 58,659 | 2.8% |
| 2017 | 62,557 | 1.6% | 59,615 | 1.6% |
| 2018 | 65,937 | 5.4% | 62,807 | 5.4% |
| 2019 | 69,009 | 4.7% | 65,230 | 3.9% |
| 2020 | 74,181 | 7.5% | 69,434 | 6.4% |
| CAGR | 3.5% | 3.4% | ||
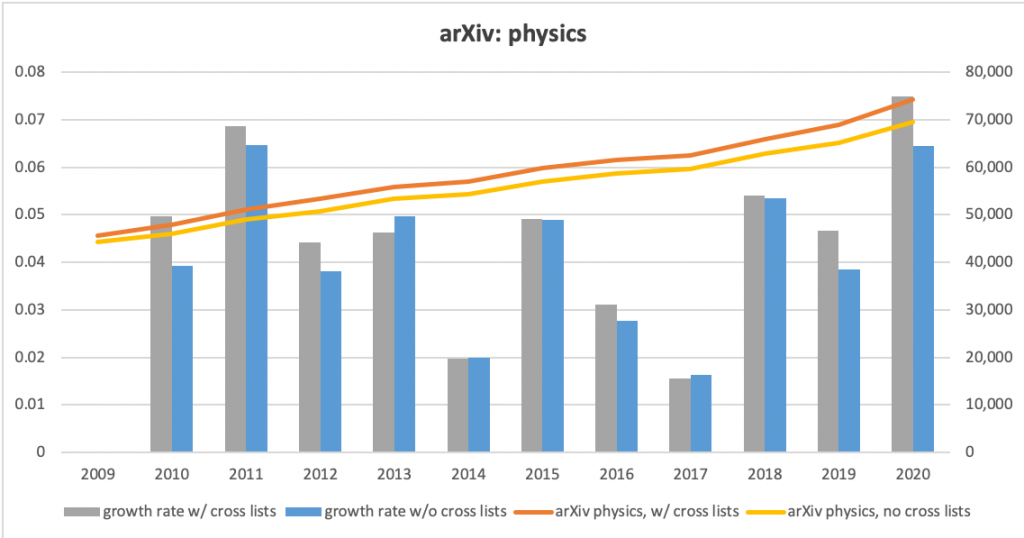
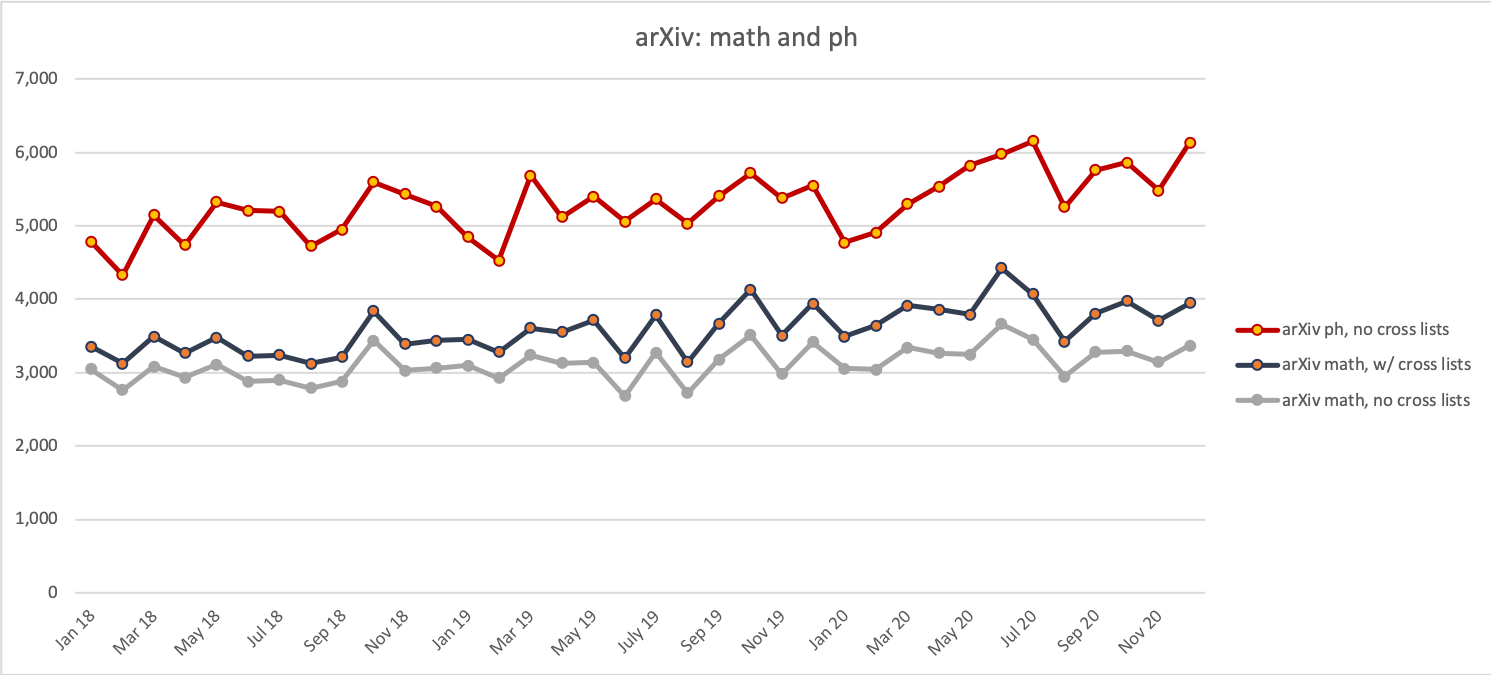
I also looked at monthly submission rates for mathematics and for physics for 2018 to 2020. There are definitely peaks and valleys in the monthly data, with both mathematics and physics having peaks around June – July 2020.
bioRxiv data
I also looked at data from the bioRxiv. Obtaining a list of monthly counts of submissions was fairly easy, using their API. It is hard to interpret the data for this context, though. For one thing, the bioRxiv has only been operating since November 2013. Acceptance of the bioRxiv for preprints in biology and medicine is not yet as strong as the acceptance of the arXiv by mathematicians and physicists. Mostly what the table shows is the growth of acceptance of the bioRxiv. For completeness, here are the counts and the growth rates from the bioRxiv.
| Year | New papers | Growth rate |
| 2013 | 109 | |
| 2014 | 886 | 713% |
| 2015 | 1,774 | 100% |
| 2016 | 4,721 | 166% |
| 2017 | 11,347 | 140% |
| 2018 | 20,783 | 83% |
| 2019 | 29,181 | 40% |
| 2020 | 38,717 | 33% |
Conclusions
There does not seem to have been an extraordinary surge in mathematics papers in 2020 compared with previous years. As mentioned already, it is possible that some disciplines had increases because researchers without access to their labs had more time available to write. A survey of SpringerNature authors indicated that, as a result of lockdowns, 65% of them intended to re-use their own data. About half of the respondents thought it is extremely or somewhat likely that the lockdown will result in the re-use of open data from other labs. The majority of mathematicians do not need to generate data in a laboratory to work. This may help to explain why mathematicians are not finding so much extra time to be writing papers during the pandemic.
Mathematical aside
Much of this post discusses changes to growth rates, i.e., second derivatives.